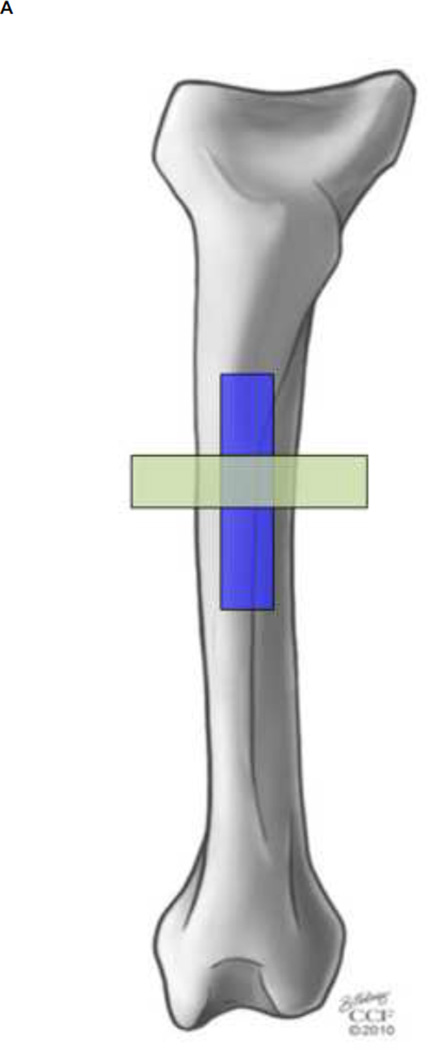
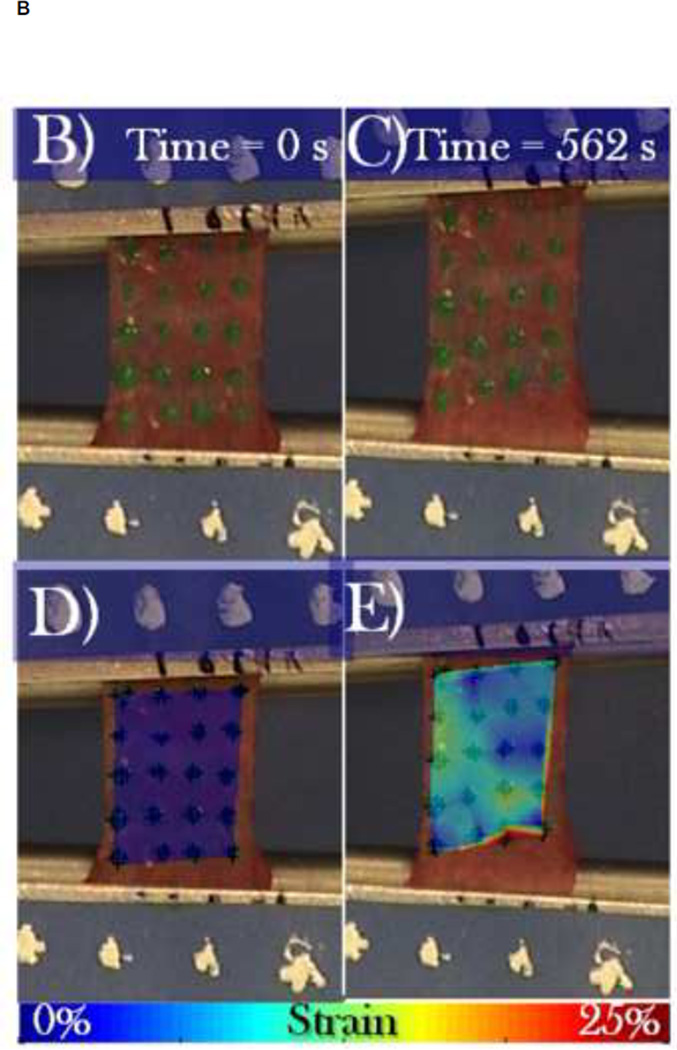
FIGURE 2.
Mechanical testing of periosteum samples in the axial and circumferential directions. (A) Schematic of location and orientation of areas from which periosteum samples are taken (blue – axial, green – circumferential) and tested in tension. (B–E) A representative sample is shown during tensile testing, at zero load (B, D) and at failure (C, E). Digital image correlation was used to calculate the strain between green spots, as depicted in color overlays (D,E), averaging at each time point to create stress-strain curves.


