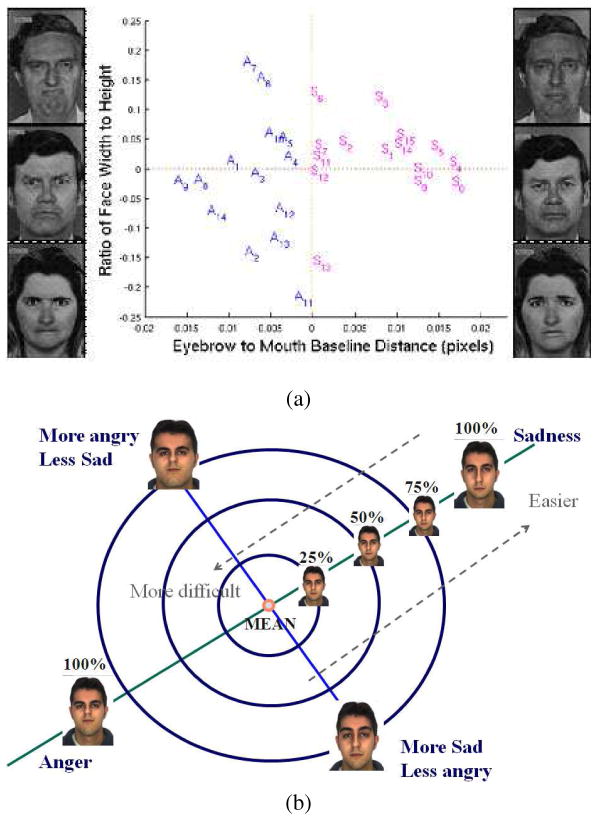
Figure 5.
(a) Shown here are the two most discriminant dimensions of the face shape vectors. We also plot the images of anger and sadness of Ekman and Friesen (1976). In dashed are simple linear boundaries separating angry and sad faces according to the model. The first dimension (distance between brows and mouth) successfully classifies 100% of the sample images. This continuous model is further illustrated in (b). Note that, in the proposed computational model, the face space defining sadness corresponds to the right-bottom quadrant, while that of anger is given by the left-top quadrant. The dashed arrows in the figure reflect the fact that as we move away from the “mean” (or norm) face, recognition of that emotion become easier.

