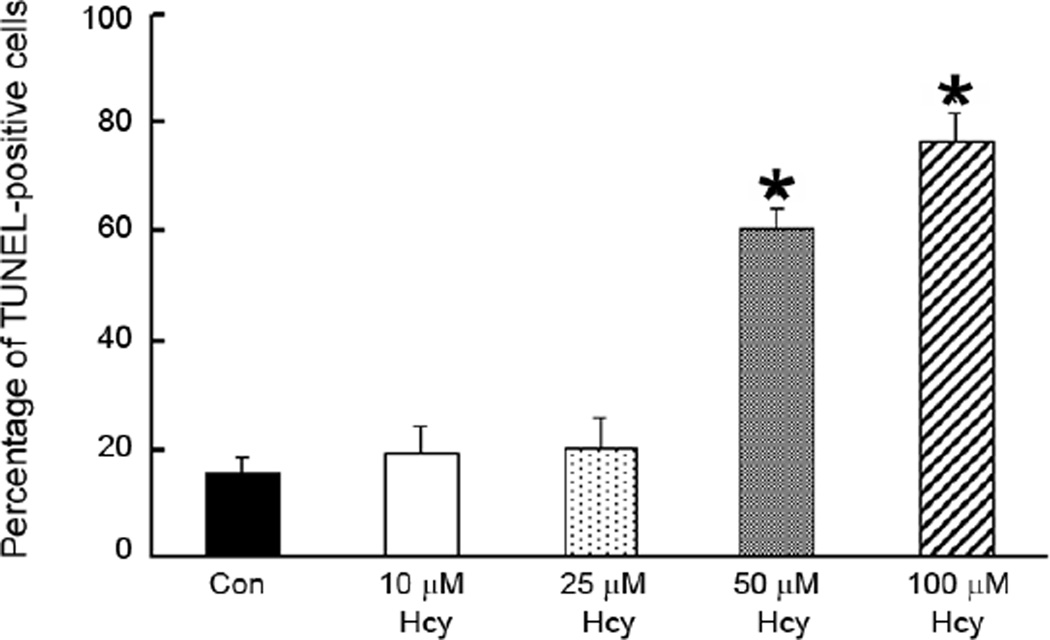
Fig. 6. Dose-dependent increase in TUNEL-positive 1°GCs following exposure to homocysteine (Hcy).
The number of TUNEL-positive cells was determined using the ApopTag fluorescein method in 1°GCs exposed to Hcy (10, 25, 50 and 100 µM) for 6 h. Data are expressed as the mean and S.E. of the ratio of dead/dying cells to the total number of cells, n = 10. (*, significantly different from control, p <0.001).

