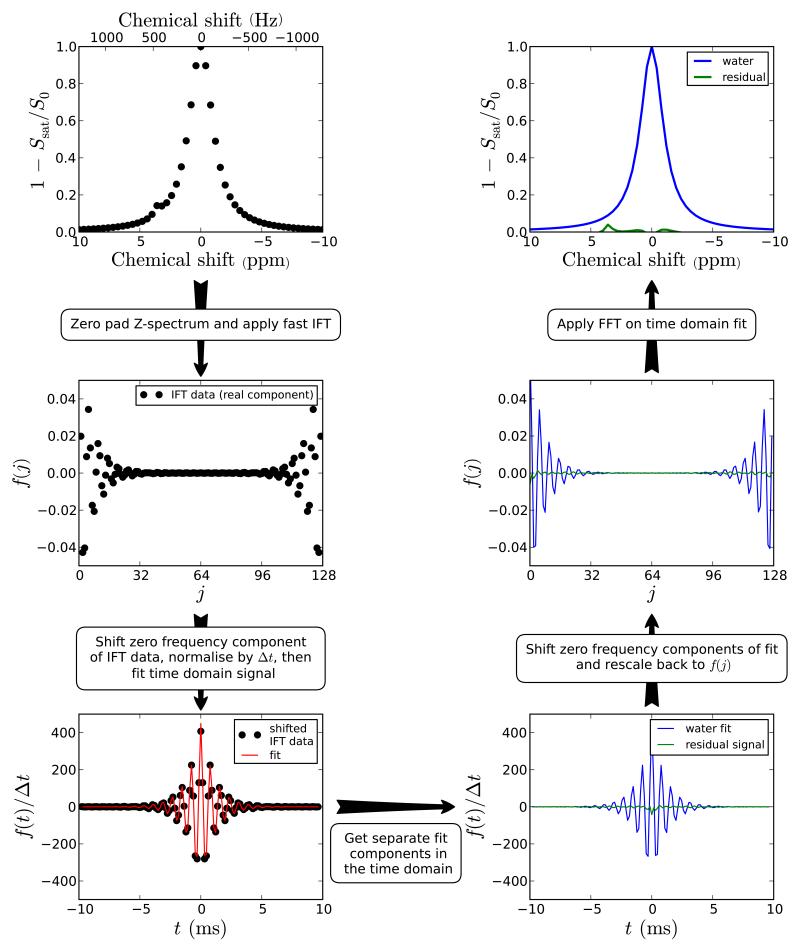
Figure 1.
Schematic diagram showing the procedure for processing Z-spectra using time domain analysis. In the first section, a Z-spectrum was simulated for two pools (water at 0 ppm and amide at 3.6 ppm) and 51 offset frequencies between 10 to −10 ppm at 3 T (128 MHz). The processing steps before the fitting are outlined on the figure with the Z-spectrum zero padded to a total of 128 points (N). After the multicomponent fit, the reverse procedure is applied to the fitted data and residual signal in order to obtain the Z-spectra. The peak amplitude of the 3.6 ppm in the resiudal spectrum is 0.040 compared to 0.044 for MTRasym. This amplitude may be used to assess the proton transfer ratio.

