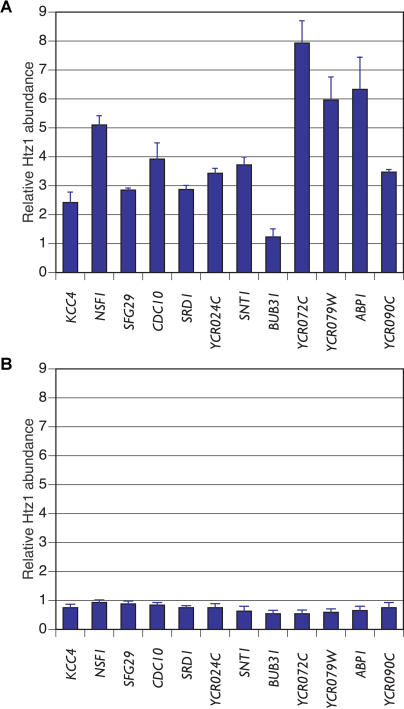
Figure 8. ChIP Analysis of H2A.Z Deposition at Nontelomeric Euchromatic Sites.
(A) ChIP results in wild type.
(B) ChIP results in swr1Δ cells. We detected a reduced enrichment of H2A.Z at all these loci when we estimated the absolute H2A.Z abundance by dividing the amount of immunoprecipitated DNA by the amount of total input DNA for each locus.

