
FIGURE 2.
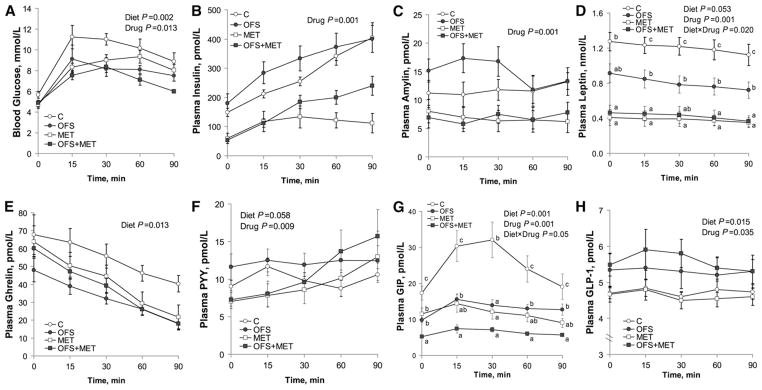
Blood glucose (A), insulin (B), amylin (C), leptin (D), ghrelin (E), PYY (F), GIP (G), and GLP-1 (H) concentrations of obese rats during an OGTT. Values are mean ± SEM, n = 10. Labeled means at a time without a common letter differ, P < 0.05. C, control; GIP, glucose-dependent insulinotropic polypeptide; GLP-1, glucagon-like peptide 1; MET, metformin; OFS, oligofructose; OGTT, oral glucose tolerance test; PYY, peptide tyrosine tyrosine.