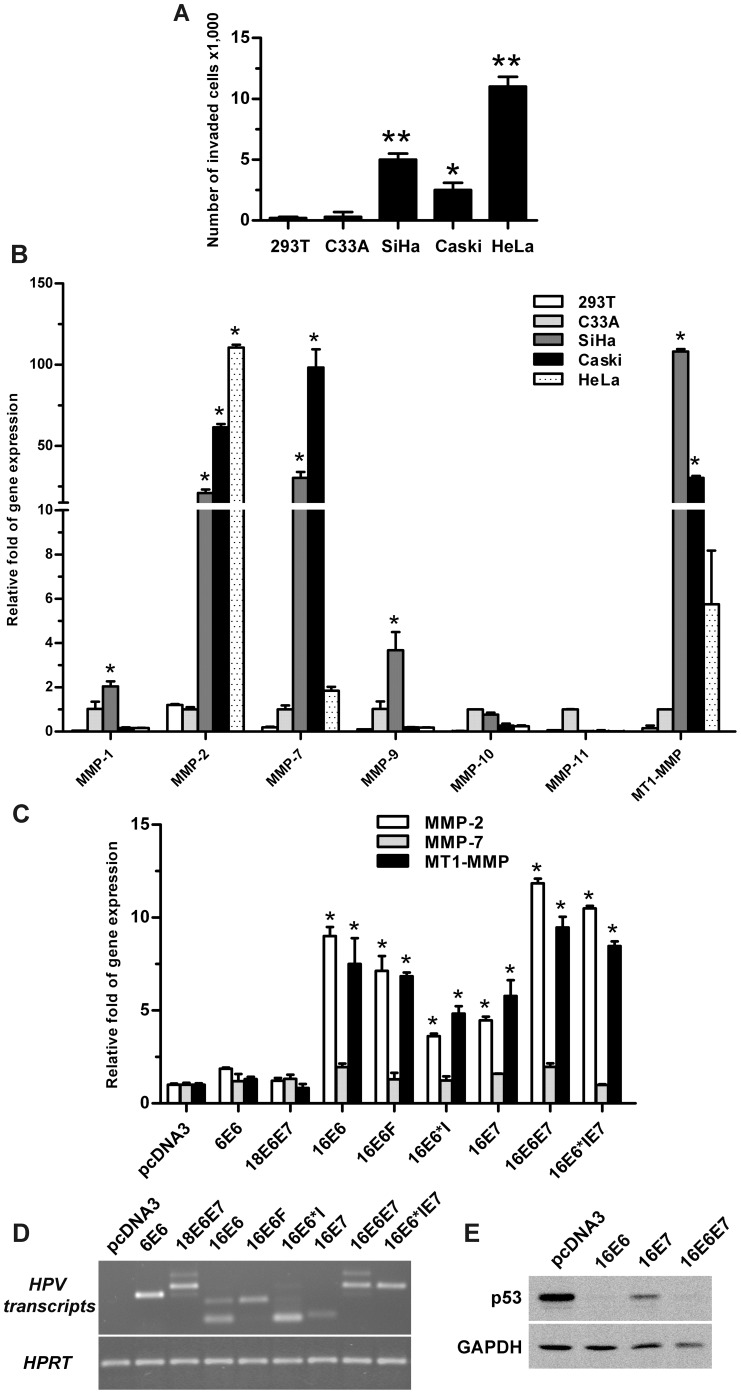
Figure 1. In vitro invasion and MMP expression of HPV positive, HPV negative and HPV oncoprotein expressing C33A.
(A) Quantitation of invasion using migration through filters coated with Matrigel for HPV positive (SiHa, Caski and HeLa) and negative (C33A and 293T) cells presenting as numbers of invading cells. (B) Relative expression of MMP-1, -2, -7, -9, -10, -11 and MT1-MMP measured in cell lines using qPCR. Data was normalized to C33A. *:p-value<0.05 relative to C33A. (C) Relative expression of MMP-2, -7 and MT1-MMP in C33A cells stably expressing different HPV16 (16E6, 16E6F, 16E6*I, 16E7, 16E6E7, 16E6*IE7), HPV18 (18E6E7) and low-risk HPV6 (6E6) oncoproteins as measured by qPCR and normalized to pcDNA3. *p-value<0.05 compared to pcDNA3 expressing cells. (D) The level of HPV transcripts compared to the control, HPRT, in each cell line as shown by RT-PCR. (E) P53 degradation activity of 16E6, 16E7 and 16E6E7 was compared by western blot analysis. GAPDH was used as loading control.

