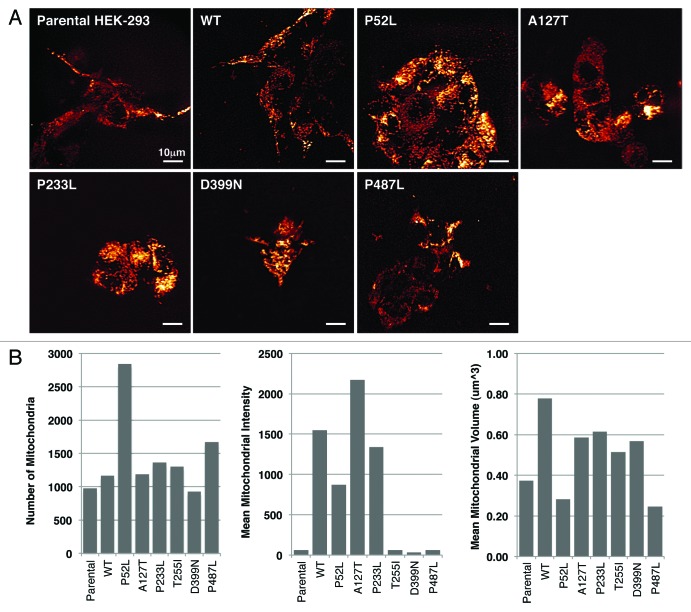
Figure 2. (A) Live-cell confocal images of HEK-293 cells expressing various mutants of PXN labelled with MitoTracker Red. The panel represents single time point photographs of untransfected parental HEK-293 cells, wild-type and mutant PXN. (B) Multiple images analysed with Imaris software show the number of mitochondria, mean intensity of MitoTracker Red indicating mitochondrial energy levels, and mean volume (indicating the level of average mitochondrial volume).

An official website of the United States government
Here's how you know
Official websites use .gov
A
.gov website belongs to an official
government organization in the United States.
Secure .gov websites use HTTPS
A lock (
) or https:// means you've safely
connected to the .gov website. Share sensitive
information only on official, secure websites.
