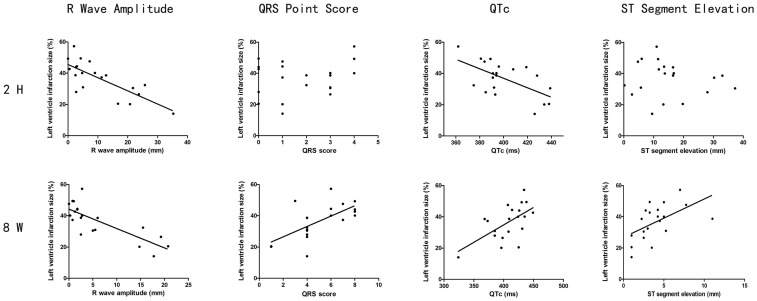
Figure 2. Correlation between the ECG wave changes at 2 h or 8 wks and the size (%) of myocardial infarction.
The regression lines are shown in the figure. The calculated correlations as follows: R wave amplitude at 2 H: r = −0.764 (p = 0.000); at 8 W: r = −0.788 (p = 0.000). QRS score at 2 H: r = 0.237 (p = 0.315); at 8 W: r = 0.652 (p = 0.002). QTc at 2 H: r = −0.605 (p = 0.005); at 8 W: r = −0.600 (p = 0.005). ST segment elevation at 2 H: r = −0.120 (p = 0.615); at 8 W: r = 0.542 (p = 0.014).

