
Figure 4. Reduced hippocampal torsinA in Dyt1 ΔGAG heterozygous KI mice.
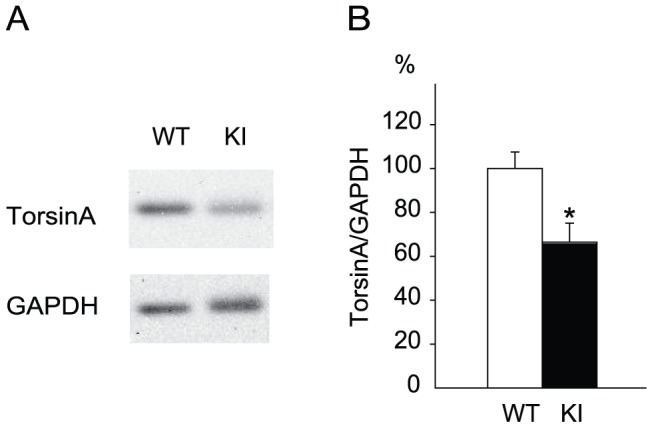
A representative band image of western blot (A) and the quantified hippocampal torsinA levels (B) from WT and Dyt1 ΔGAG heterozygous KI mice. The density of the torsinA band was standardized to that of GAPDH. The data in WT littermates were normalized to 100%. The vertical bars represent means ± standard errors. *p<0.05.