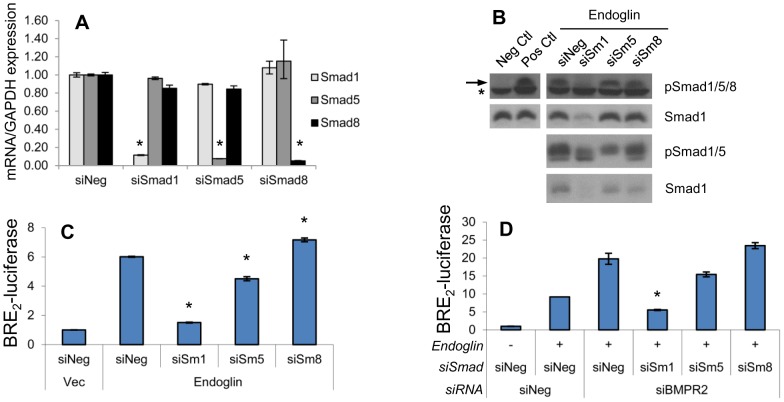
Figure 3. Smad1 is the main downstream target of endoglin.
PC3-M cells were transfected with endoglin, vector (Vec), or with siRNA to Smad1, (siSm1), Smad5 (siSm5), Smad8 (siSm8), BMPRII (siRII) or non-targeting (siNeg), and processed 48 hrs later as indicated. A) Smad-targeting siRNA suppresses transcript in a Smad-specific fashion. Smad1, -5, and -8 mRNA expression was assessed via qRT-PCR, normalized to GAPDH, and expressed relative to siNeg-transfected cells (normalized to 1.0). Data represent mean ± SD from a single experiment conducted in replicates of N = 2, that was repeated 3 separate times (also in replicates of N = 2) with similar results. *, p≤0.05 compared to siNeg. B) Effect of siRNA on phospho-Smad1/5/8, phospho-Smad1/5, and total Smad1 protein levels. Cell lysates were probed by antibody directed towards phospho-Smad1/5/8 (pSmad1/5/8) and total Smad1 protein by Western blot. The non-specific band (*) immediately under the pSmad1/5/8 band (arrow) confirms even loading. Negative control cells (Neg Ctl) were transfected with vector and serum starved overnight. Positive control cells (Pos Ctl) were transfected with endoglin, not serum starved and were treated with TGFβ for 30 min. Separate samples were similarly transfected and treated, and cell lysates were probed for phospho-Smad1/5 (pSmad1/5). Data are from one representative experiment in each case, repeated 3 separate times with similar results. C) Endoglin-mediated BRE2-luciferase activity is largely mediated by Smad1. Cells were transfected with endoglin and were additionally co-transfected with BRE2- and Renilla luciferase construct, and luciferase assays performed. Data represent mean ± SD of a single representative experiment conducted in replicates of N = 2, repeated 3 separate times (replicates of N = 2) with similar results. *, p≤0.05 compared to Endoglin/siNeg. D) BMPRII-mediated suppression of BRE2-luciferase activity is largely mediated by Smad1. Cells were transfected as in (C) with addition of indicated siRNA and luciferase activity as assessed as above. Data represent mean ± SD of a single representative experiment conducted in replicates of N = 2, repeated 2 separate times (replicates of N = 2) with similar results. *, p≤0.05 compared to Endoglin/siNeg/siBMPRII.

