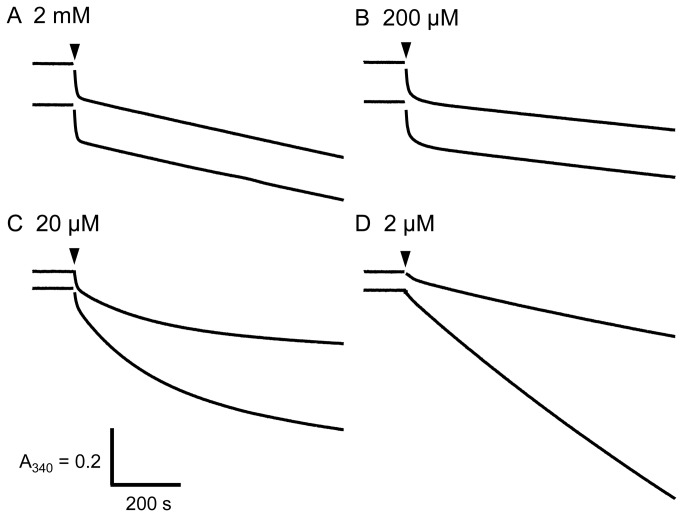
Figure 1. Time-course of ATP hydrolysis by BF1 with or without the ε subunit.
In each panel, the upper and lower traces represent α3β3γ and α3β3γε, respectively. The final concentration of α3β3γ or α3β3γε complex of BF1 was 30 nM. The ATP concentrations are indicated in the figure. The α3β3γ or α3β3γε complex of BF1 was added at the time indicated by the arrowheads. The vertical and horizontal bars denote 0.2 absorbance units and 200 s, respectively.

