Figure 3.
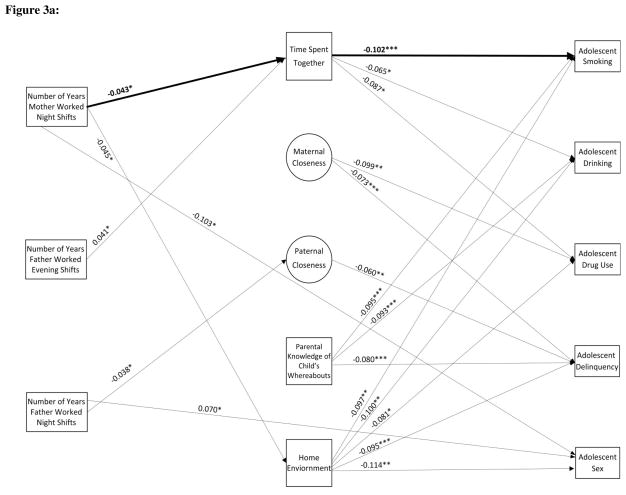
Figure 3a: Pathways linking Parental Work Schedules to Adolescent Risky Behaviors, Developmental Stage Before Age 5
Note: N = 4175. CFI=.913; RMSEA=.033; χ2(df=114)=642.804. Numbers shown are standardized coefficients. A bolded line represents a mediated pathway that is significant at at least the 5% level. Model controls for child’s gender, race/ethnicity, having siblings, born low birth weight, mother’s age, marital status, and education at birth, family income the year before birth, number of years receiving welfare, number of years living in single-mother families, mother smoking during pregnancy, mother drinking alcohol during pregnancy, mothers’ average weekly work hours, number of years mothers working at professional, sales, or service-sector jobs, and father’s average weekly work hours. Standard errors were adjusted using bootstrapping to account for dependency across families. * p < .05, ** p < .01, *** p < .001.
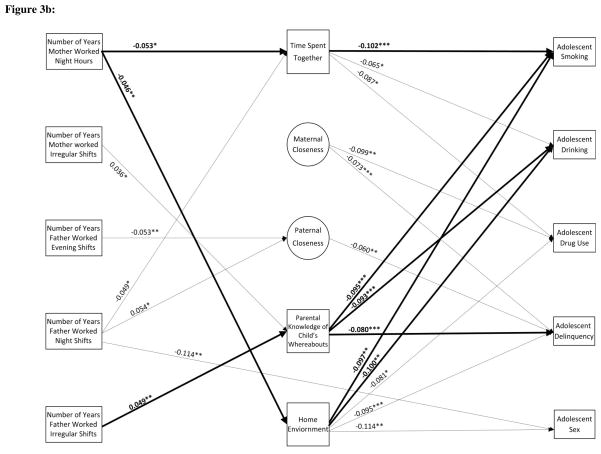
Figure 3b: Pathways linking Parental Work Schedules to Adolescent Risky Behaviors, Developmental Stage Between Ages 5 and 10
Note: N = 4175. CFI=.913; RMSEA=.033; χ2(df=114)=642.804. Numbers shown are standardized coefficients. A bolded line represents a mediated pathway that is significant at at least the 5% level. Model controls for child’s gender, race/ethnicity, having siblings, born low birth weight, mother’s age, marital status, and education at birth, family income the year before birth, number of years receiving welfare, number of years living in single-mother families, mother smoking during pregnancy, mother drinking alcohol during pregnancy, mothers’ average weekly work hours, number of years mothers working at professional, sales, or service-sector jobs, and father’s average weekly work hours. Standard errors were adjusted using bootstrapping to account for dependency across families. * p < .05, ** p < .01, *** p < .001.
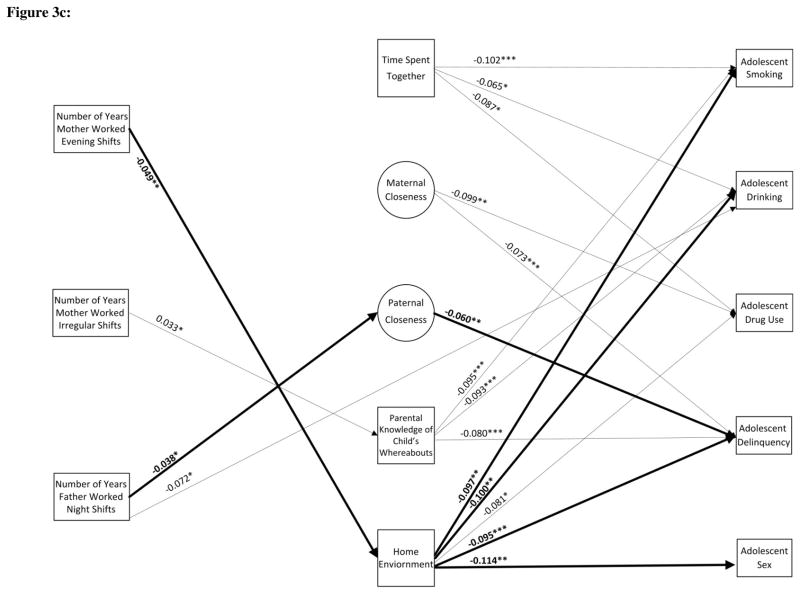
Figure 3c: Pathways linking Parental Work Schedules to Adolescent Risky Behaviors, Developmental Stage Between Ages 11 and 12
Note: N = 4175. CFI=.913; RMSEA=.033; χ2(df=114)=642.804. Numbers shown are standardized coefficients. A bolded line represents a mediated pathway that is significant at at least the 5% level. Model controls for child’s gender, race/ethnicity, having siblings, born low birth weight, mother’s age, marital status, and education at birth, family income the year before birth, number of years receiving welfare, number of years living in single-mother families, mother smoking during pregnancy, mother drinking alcohol during pregnancy, mothers’ average weekly work hours, number of years mothers working at professional, sales, or service-sector jobs, and father’s average weekly work hours. Standard errors were adjusted using bootstrapping to account for dependency across families. * p < .05, ** p < .01, *** p < .001.


