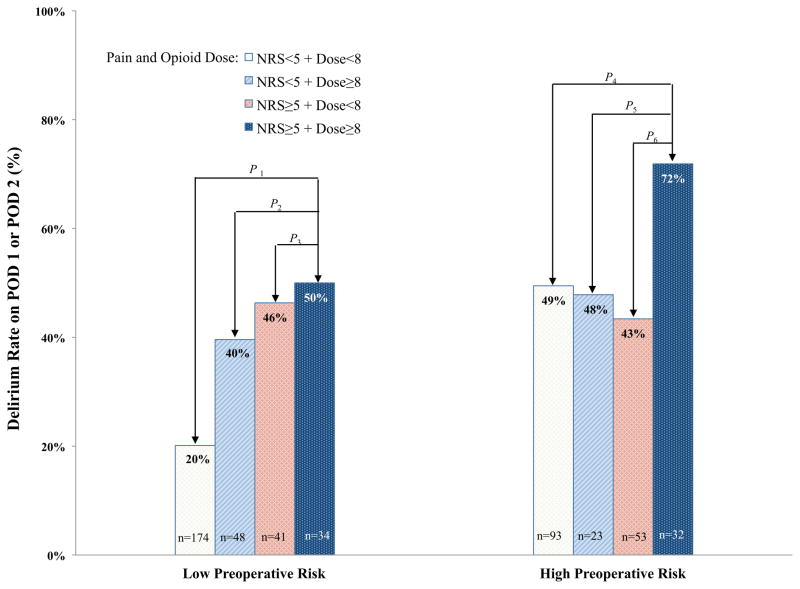
Figure 2. Delirium Rate by Preoperative Risk Group, Pain, and Opioid.
The incidence of postoperative delirium (%) is shown, stratified by whether the patients were in the low vs. high preoperative risk categories. A logistic regression was performed in each preoperative risk group. Comparisons were made on the effects of different combinations of pain status and opioid doses on incident delirium. The reference group for this comparison was patients with low pain and low opioid dose, within each risk category.
The test statistics and P-values are as follows:
P1: χ2(df=1) = 12.40, P = .0004. P2: χ2(df=1) = 0.87, P = .350. P3: χ2(df=1) = 0.10, P = .752. P4: χ2(df=1) = 4.66, P = .031. P5: χ2(df=1) = 3.20, P = .074. P6: χ2(df=1) = 6.26, P = .012.
POD = postoperative day, NRS = numerical rating scale of pain assessment

