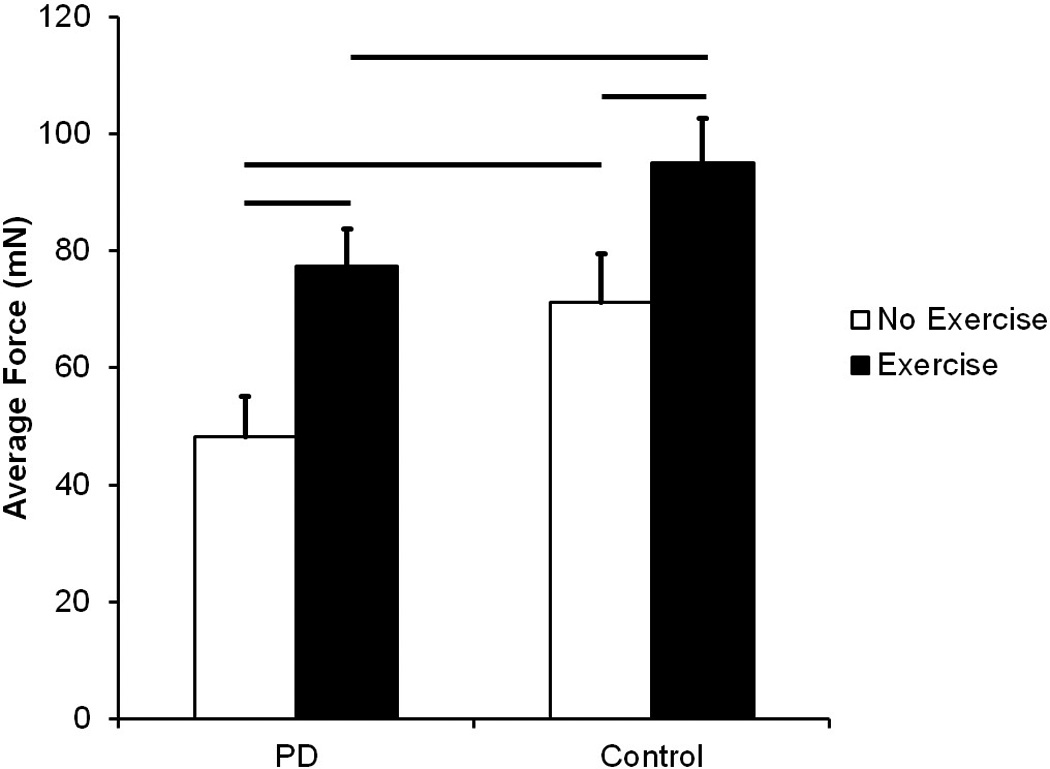
Figure 4.

Average Tongue Force in milliNewtons (mN). Data are expressed as mean and SEM. Both the PD No Exercise group and the PD Exercise group had significantly lower average tongue forces than the Control No Exercise group and the Control Exercise group, respectively. Significant increases in average tongue force were found with exercise in both conditions. Comparisons were made using a one-way analysis of variance (ANOVA) and post hoc analyses were performed using Fisher’s LSD. Bars represent p-value < 0.05.
