
Figure 5.
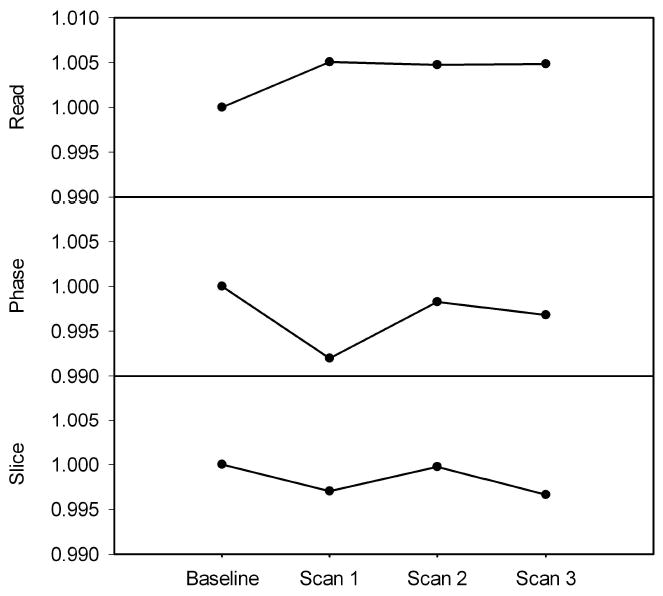
Variation in gradients over time derived from SPM8 affine matrix. The baseline point is made by averaging five images collected on the same day. The error bars on the baseline data are within the symbol size. The data shows that there is small interday variation in the gradient strengths of our system where the largest variation is detected was 0.8% (phase direction, second time point).