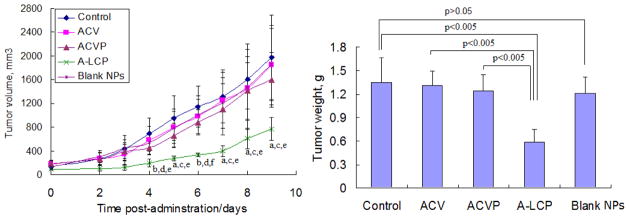
Fig. 4.

In vivo efficacy assay of A-LCP NPs. (A) Tumor growth kinetics with dosing every other day for 5 times. Data are expressed as mean ± S.D, (n=5). a p<0.05 and b p<0.01 vs. the control, c p<0.05 and d p<0.01 vs. free ACV, e p<0.05 and f p<0.005 vs. free ACVP. (B) Tumor weights of tumor-bearing mice after the treatment. Data are expressed as mean ± S.D, (n=5).
