
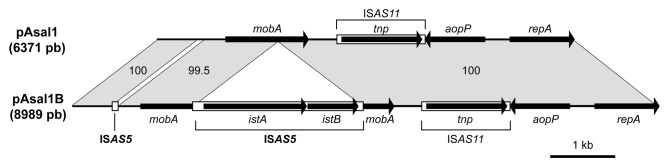
Figure 2. Maps of the pAsal1 and pAsal1B plasmids. Genes are illustrated by arrows while IS elements are illustrated by rectangles. The numbers between the two plasmids indicate the identity (in %) for the plasmid regions indicated. As shown by the maps, pAsal1B contains all the elements found in pAsal1 except that a 121 bp fragment was replaced by the insertion of the 96 bp ISAS5 fragment in the first third of the plasmid. In addition, pAsal1B bears a complete ISAS5 inserted in the mobA gene.