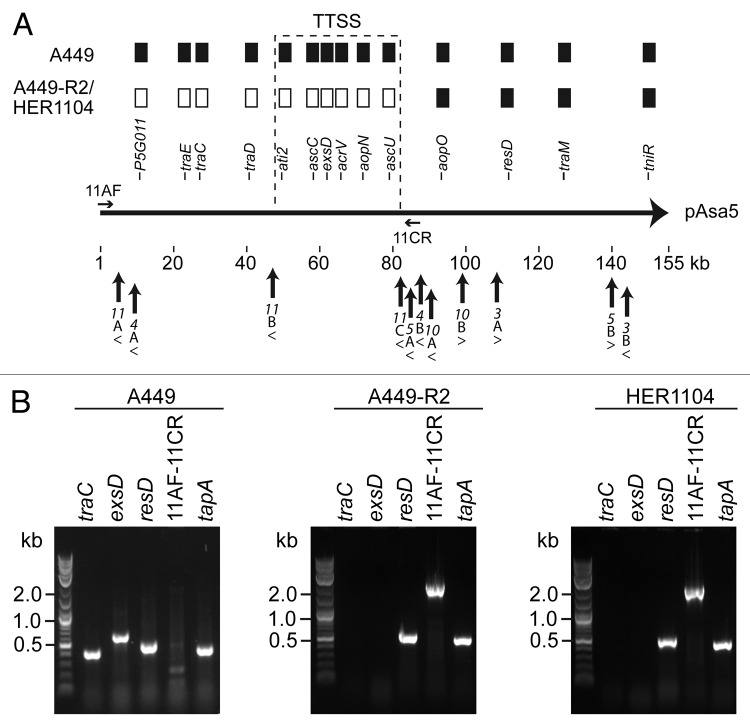
Figure 3. Analysis of pAsa5 rearrangements in HER1104. (A) Map of pAsa5 with rearrangements in A449-R2 and HER1104. As already shown 7,8, both strains displayed a loss profile 2 based on PCR analyses of 14 pAsa5 genes shown as filled rectangles on this figure when present. The positions of the primers (11AF and 11CR) used to study the pAsa5 rearrangements are also shown by horizontal arrows. The primers shown are not to scale. Upright arrows indicate IS positions on pAsa5 while arrowheads indicate the orientation of the ISs. (B) PCR analyses. Strains tested and primers used are indicated above the images of the gels. The primer pairs traC, exsD and resD targeted the corresponding genes in pAsa5, while the tapA primers were used as positive chromosome hybridization controls.

An official website of the United States government
Here's how you know
Official websites use .gov
A
.gov website belongs to an official
government organization in the United States.
Secure .gov websites use HTTPS
A lock (
) or https:// means you've safely
connected to the .gov website. Share sensitive
information only on official, secure websites.
