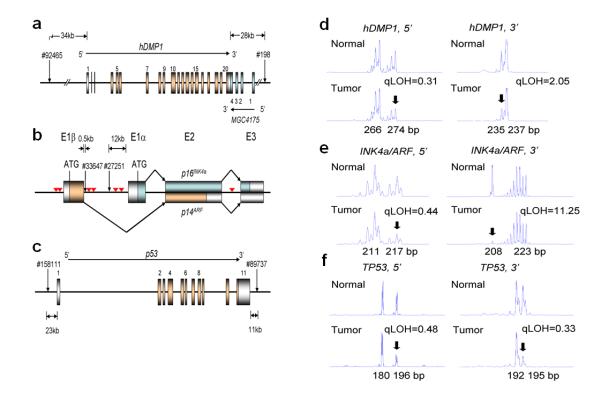
Figure 1. Representative patterns of LOH for hDMP1, INK4a/ARF, and p53 in human breast carcinoma.

Genomic DNA was extracted from paired normal and malignant breast cancer specimen and PCR was conducted with 6-FAM-labeled primers that amplify the dinucleotide repeats within (or close to) each locus (12, 15). The area peaks of the PCR products were quantitated by ABI 3730xl DNA analyzer. The qLOH values were determined through the following equation: qLOH = Area Peak 1/Area Peak 2 (normal tissue) divided by Area Peak 1′/Area Peak 2′ (tumor tissue). The arrows indicate the peak that was lost in tumor cells. The sample was considered to have LOH when the value was >2.0 or <0.5.
a, genomic locus of the hDMP1 gene. The two different primer sets were designed to amplify the dinucleotide repeat sequences located on the 5′ and 3′ end of the hDMP1 gene. The noncoding exons were colored silver and the coding exons were colored gold.
b, genomic structure of the human INK4a/ARF locus. The two sets of PCR primers were designed to detect the dinucleotide repeats within 500 bps of Exon 1β (#33647) and those between Exon 1β and Exon 1α (#27251). The inverted triangles shown in red indicate the location of high-affinity hDMP1-binding sites.
c, genomic structure of the human p53 gene and the location of the PCR primers used for LOH analyses.
d, LOH analysis of breast cancer with hDMP1 primer sets. 5′:#2006-1202, qLOH = 0.31; 3′: #2004-817, qLOH = 2.05
e, LOH analysis with INK4a/ARF primer sets. 5′: #2008-1476, qLOH = 0.44; 3′: #1999-84, qLOH = 11.25
f, LOH analysis with p53 primer sets. 5′: #2008-1272, qLOH = 0.48; 3′: #2008-26, qLOH = 0.33
