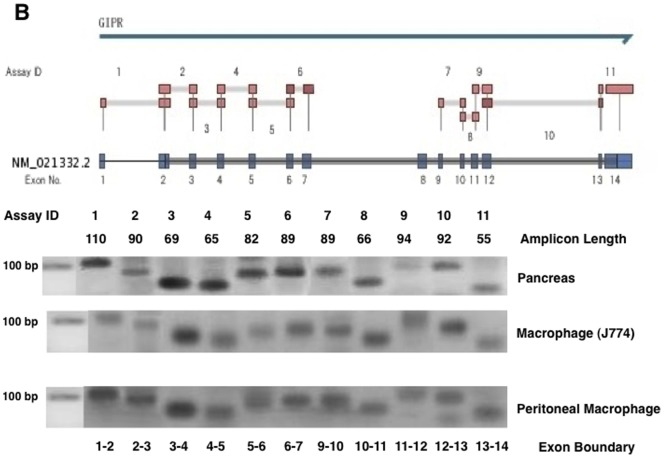
Figure 8. GIPR gene expression.
GIPR mRNA levels in the pancreas and the exudate peritoneal macrophages obtained from Apoe −/− mice, and J774A1 mouse macrophages were determined by real-time RT-PCR with 11 primers encoding different exons of the GIPR shown in Supplementary data. The amplification products visualized by gel electrophoresis had the expected lengths (bp).

