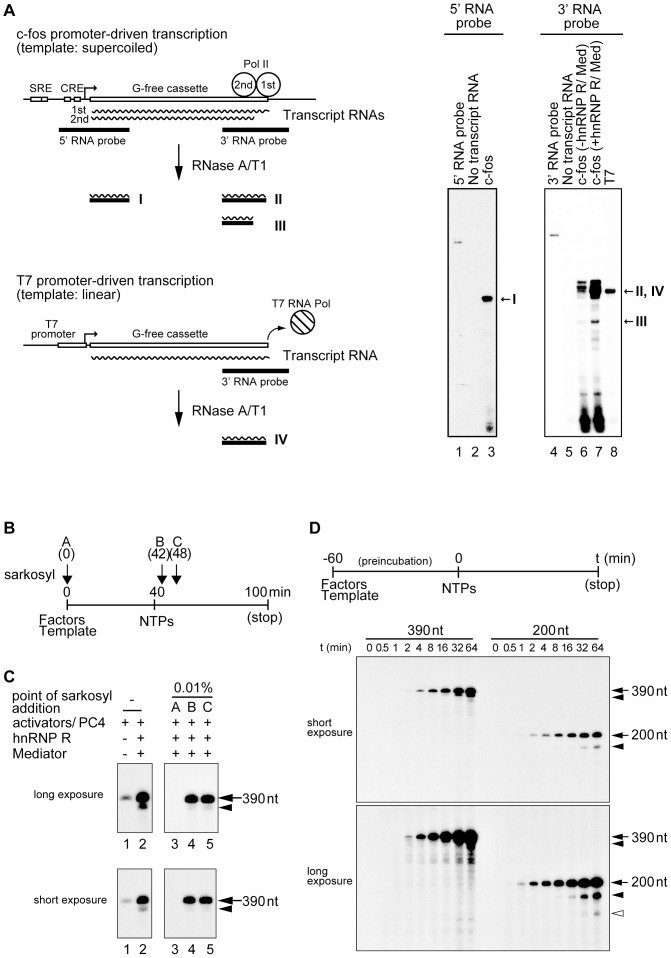
Figure 2. hnRNP R facilitates transcription reinitiation in the presence of Mediator.
(A) RNase protection assays were performed using the 32P-labeled RNA probes against the 5′ or 3′ region of the G-free cassette. After hybridization of each 32P-labeled probe and the transcripts, the products were treated by RNase A and T1 to remove the unhybridized regions. The digested products were separated on an 8% denaturing polyacrylamide gel and detected by autoradiography. As depicted schematically, the first- and second-round transcripts are transcribed by the Pol II system from the supercoiled c-fos template. The two c-fos transcripts produce a single band (I) when the 5′ probe is used for the RNase protection assay while they produce two bands (II and III) when the 3′ probe is used. By contrast, a single control transcript is transcribed by T7 RNA polymerase from the linear control template. This T7 promoter-based transcript produces a single band (IV) even when the 3′ probe is used for the same RNase protection assay. The results of the RNase protection assays are shown in the right panels, and the positions of the expected products are indicated on the right (I, II, III and IV). The used probe (5′ or 3′ RNA probe) is indicated on the top and loaded in lane 1 or 4. No transcript RNA indicates that the 5′ or 3′ RNA probe was treated by RNaseA/T1 without hybridization with any transcript RNAs, and c-fos (-hnRNP R/Med) or c-fos (+hnRNP R/Med) indicates the transcripts from c-fos promoter-driven transcription in the absence or presence of hnRNP R and Med(0.85), respectively. T7 indicates the transcript produced from T7 promoter-driven transcription. (B) GTFs, Pol II, the four activators (SRF, Elk-1, CREB and ATF1), PC4 and the template pfMC2AT(390) were incubated at 30°C for 40 min to form preinitiation complex, and then ATP, CTP, UTP and 3′-O-methyl-GTP (NTPs) were added to initiate transcription. After additional 60-min incubation, 20 mM EDTA pH 8.0 and 0.2% SDS were added to stop the reaction. hnRNP R and 3xF:Mediator were added as indicated in the figure. 0.01% Sarkosyl was added before preinitiation complex formation (A: 0 min) or immediately after initiation of transcription (B: 42 min, C: 48 min). (C) The transcripts from the reactions were separated on a 5% denaturing polyacrylamide gel and detected by autoradiography. The positions of the 390-nt transcript (arrow) and the second-round transcript (arrowhead) are indicated on the right. (D) Time-course analyses of the reinitiation products were performed using the pfMC2AT (390) or pfMC2AT (200) template. t indicates the incubation time (min) after the addition of the nucleotides. The upper panel shows the outline of the experiment. The positions of the first- (arrow), second- (arrowhead) and third-round transcripts (white arrowhead) are indicated on the right.

