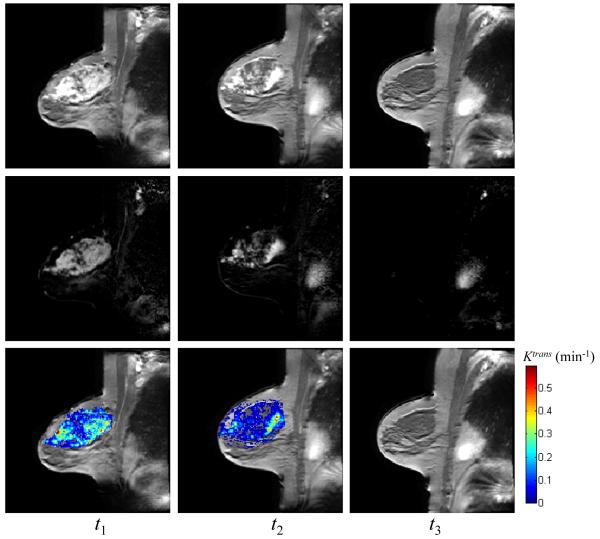
Figure 1.
The averaged post-contrast MR images (top row), the difference images between pre- and post-contrast DCE data (middle row), and Ktrans values superimposed on the averaged post-contrast images (bottom row) at three time points (three columns) for one pathological complete responder. The mean values of Ktrans at three time points estimated by TK are 0.21 min−1, 0.19 min−1, and 0 min−1, respectively, using a 80% enhancement threshold.

