
Figure 3.
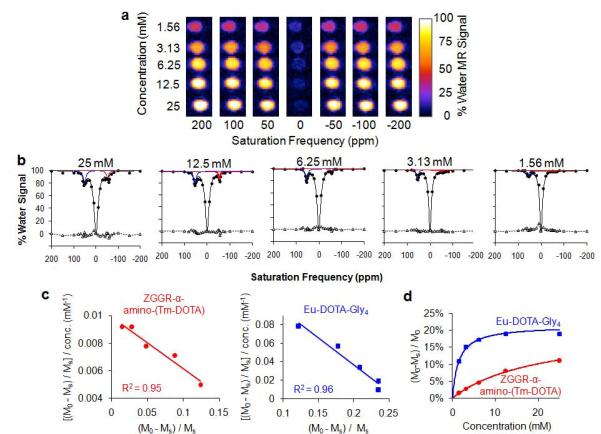
Quantitative evaluation of the concentration dependence of CEST for each agent. a) Serially-diluted chemical solutions, with each solution containing both contrast agent at the same concentration, were used to acquire 31 CEST-FISP MR images with selective saturation ranging from +200 to −200 ppm. Only 7 of the 31 images are shown. b) A function of three Lorentzian line shapes was fit to each CEST spectrum to measure each CEST effect of ZGGR-α-amino-(Tm-DOTA) (red) and Eu-DOTA-Gly4 (blue). Fitting residuals are shown as triangles with a dashed line. The residuals had a standard deviation ranging from 1.1% to 2.5% water signal for each fitting, which attested to the excellent quality of the fittings. c) The CEST results and concentrations were fit with a Hanes-Woolf-like linear analysis method based on a two-pool model of chemical exchange between only one agent and water. The excellent fitting indicated that each CEST effect can be approximated as a two-pool model, so that the direct interaction of the two CEST agents can be considered to be negligible. d) Based on results from the Hanes-like analysis method, the CEST effects of each PARACEST agent showed a typical correlation with concentration.