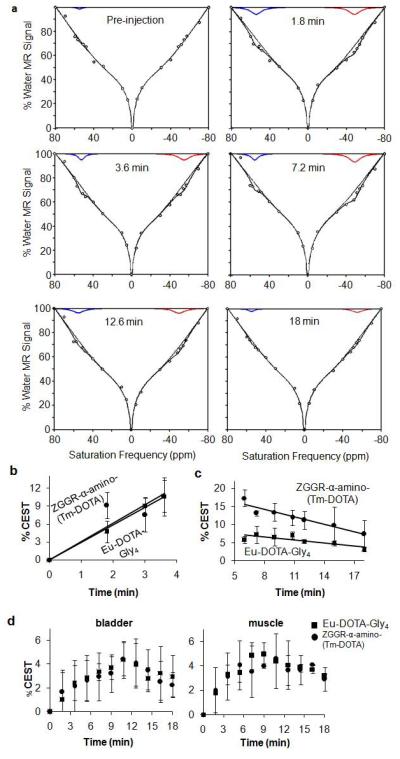
Figure 6.

CatalyCEST MRI. a) A function of three Lorentzian line shapes and one super-Lorentzian line shape was fit to each CEST spectrum (circles). The Lorentzian line shapes corresponding to ZGGR-α-amino-(Tm-DOTA) and Eu-DOTA-Gly4 are shown, the sum of the four (super)-Lorentzian line shapes are also shown, and the sum of the super-Lorentzian line shape and the Lorentzian line shape of the direct saturation of water are also shown. b) Each agent showed the same initial tumor uptake rates, c) but the rates of CEST disappearance from the tumor were different for each agent. The faster CEST disappearance from ZGGR-α-amino-(Tm-DOTA) was attributed to uPA activity. d) The agents had the same pharmacokinetics in the bladder and muscle.
