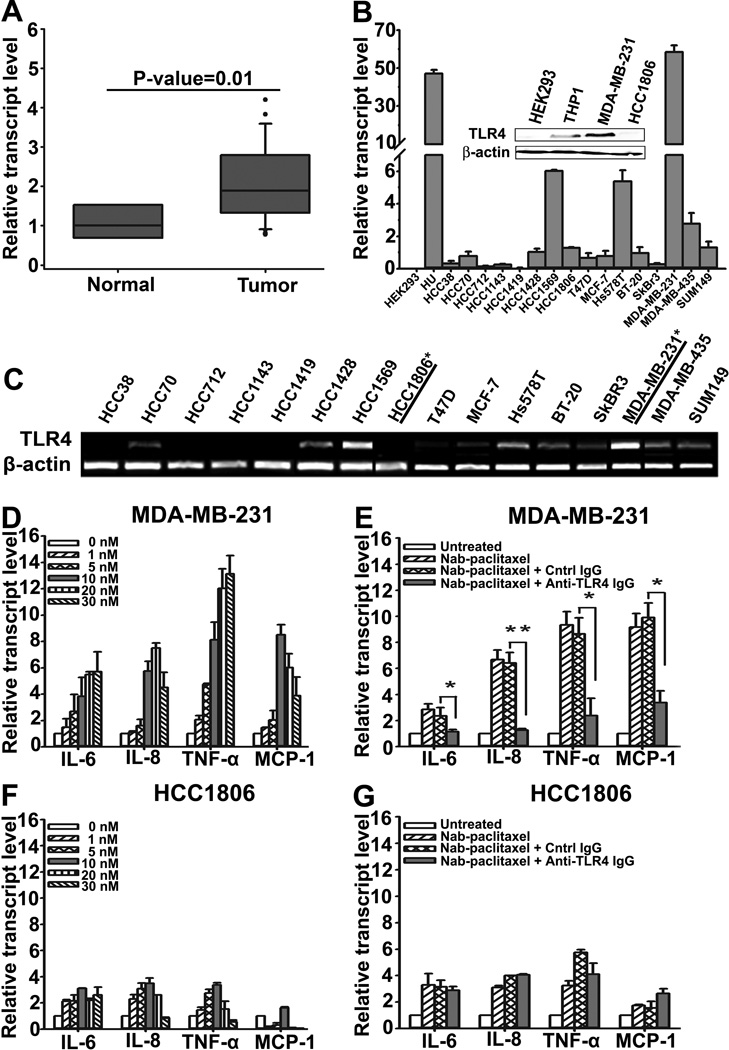
Figure 1. Frequency of TLR4 expression in human BC tumors and lines.
(A) Analysis of TLR4 mRNA in human normal breast (n=5) and tumors (n=20) by RT-qPCR. (B) RT-qPCR analysis of TLR4 mRNA in BC lines. Insert: Western blot of TLR4 protein expression in MDA-MB-231 and HCC1806 cells. HEK293 and THP1 represent lines with negative and positive TLR4 expression, respectively. (C) RT-PCR analysis of TLR4 mRNA expression in cell lines. Underline and asterisk indicates the cell lines to represent TLR4+ and TLR4− lines. (D, F) Activation of TLR4 pathway by paclitaxel inMDA-MB-231 and HCC1806 cells. RT-qPCR quantification of IL-6, IL-8, TNFα and MCP-1 in cells treated with nab-PXL (0–30nM) for 48hrs. (E, G) MDA-MB-231 and HCC1806 cells were pre-treated with control-IgG or anti-TLR4 antibody (4ug/ml) for 2hrs before nab-PXL treatment (10nM) and analyzed as in 1D. Data are presented as β-actin normalized mRNA expression ±S.D. from two experiments done in duplicate. The P-values represent * <0.05 and ** <0.01 vs. control as determined by Student’s paired t test.

