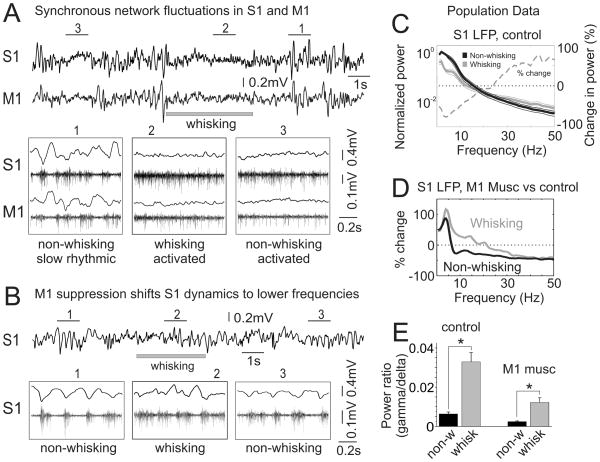
Figure 1. Suppressing vM1 in waking mice shifts S1 network dynamics to lower frequencies.
(A) Top traces, simultaneous LFP recordings in S1 (top) and vM1 (bottom) in a head-fixed, waking mouse. A period of spontaneous whisking is noted by the gray bar. Bottom traces, expanded regions of above, showing LFP (top) and MUA (bottom) for both S1 and vM1 recordings. Note activated network dynamics in S1 and vM1 associated with both whisking and non-whisking periods, and slow rhythmic dynamics during non-whisking. (B) Layout as above, recording from the same S1 site during focal vM1 suppression by local muscimol injection. LFP and MUA display enhanced slow rhythmic features, during both whisking and non-whisking. (C–E) Population data, analyses of S1 LFP signals, parsed into whisking (gray) and non-whisking (black) periods. (C) Normalized S1 LFP power spectra during control conditions, comparing whisking and non-whisking; thick lines are mean, thin lines +/− standard error. The gray dashed line is percent change [100*(whisking-non)/non], referencing scales at the right border of the graph. Dotted black lines [C,D] indicate zero change in power. (D) Changes in the S1 LFP power spectra comparing control and vM1 muscimol conditions [100*(muscimol-control)/control], for whisking and non-whisking periods. Positive-going changes indicate increased power during vM1 suppression. (E) Comparisons of S1 LFP gamma/delta power ratio for control (left) and vM1 muscimol (right) conditions. In both conditions whisking increased the gamma/delta ratio, although vM1 suppression significantly impacted the range of modulation. Bar graphs (in all figures) are mean +/− standard error. *, p<0.01. See also Supplemental Figure 1.

