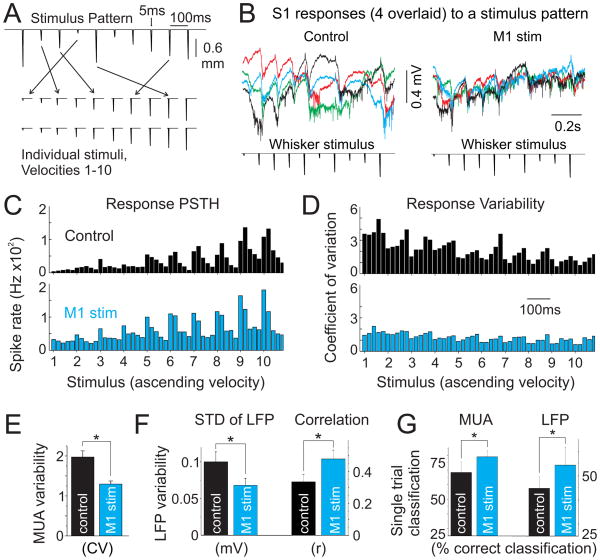
Figure 8. vM1 stimulation enhances S1 representation of complex stimuli.
(A) Top, example stimulus pattern, consisting of 10 randomly ordered rapid deflections of the principal whisker delivered at 10 Hz. Bottom, resorting of stimulus patterns into individual stimuli according to velocity, which was used for CV analyses. (B) Single trial examples of raw data (0.3 Hz-5 kHz) from one experiment, showing four overlaid responses to the same whisker stimulus pattern (bottom) during control (left) and vM1 stimluation (right) conditions. (C) Multiunit spike histograms (20 msec bins) from the experiment in [B] in response to all whisker velocities, re-ordered from smallest [1] to largest [10] velocity, for control (black, top) and vM1 stimulation (blue, bottom) trials. Stimulus numbers along the x-axis are positioned at the onset of each whisker stimulus. (D) Corresponding CV for data shown in [C]. Note the reduced variability in MUA responses when paired with vM1 stimulation (bottom), particularly for smaller amplitude sensory stimuli. (E–G) Population data, comparing control (black) and vM1 stimulation (blue) trials. (E) MUA variability, calculated as the CV of MUA responses across all stimuli. (F) LFP variability, calculated as the mean standard deviation throughout the response period (left) and the mean correlation from pair-wise comparisons of individual trials (right). (G) Correct classification percentages from linear discriminant analyses of MUA (left) and LFP (right) stimulus pattern responses. Chance is 12.5% correct classification. *, p<0.05. See also Supplemental Figure 5.

