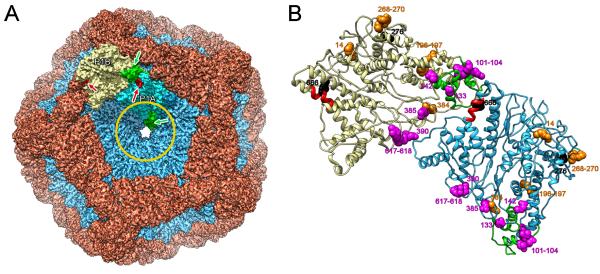
Figure 6.
(A) Regions of P1 interacting with the s-segment (green) and a monoclonal antibody (red) are shown respectively for the P1A and P1B subunits in the context of the procapsid shell. The circle represents the area covered by the P4 hexamer. (B) Locations of mutations in P1 affecting s- and m-segment binding (magenta) and packaging (orange) are shown for the P1A (cyan) and P1B (yellow) subunits. The proteolytically susceptible sites for factor Xa and trypsin are also shown (black). The subunits are oriented as in the procapsid (panel A) and viewed from the outside. See also Figure S3.

