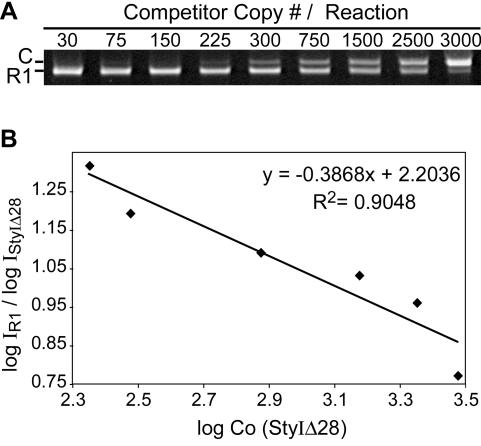
FIG. 3.
Viral loads of inoculated rabbits determined by qcPCR. HTLV-1-specific sequences (R1) were amplified from genomic DNA extracted from the PBMCs of rabbits inoculated with ACH.1 or ACH.30.1 cells in the presence of increasing competitor (C) concentrations. (A) Representative gel from PBMCs collected from R1 at 8 weeks postinoculation. (B) Regression curve for the gel in panel A. The log of the band intensity of the sample DNA, log IR1, divided by the log of the band intensity of the competitor DNA, log IStyIΔ28, was plotted against the log of the copy number of the competitor DNA, log CO (StyIΔ28). Equivalence was determined to be at the point at which the y-axis value = 1.

