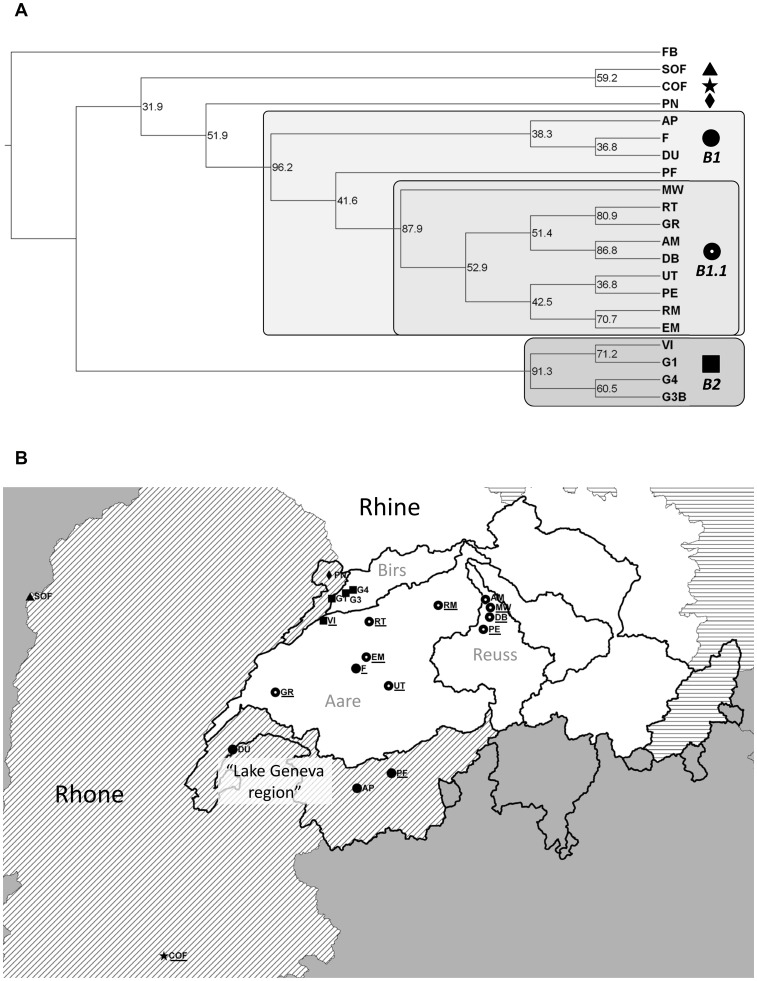
Figure 2. Population tree and geographical distribution of clusters for G. fossarum type B (FB: type A/outgroup).
The tree (a) was calculated using the Neighbour Joining method; numbers at nodes indicate bootstrap support in % (1000 bootstraps). Main clusters are named and given a symbol. The same symbols are used to indicate the geographical location of the populations in the map (b). The three major European drainages sampled in this study are shown in different shadings. The border of Switzerland and delimitations of Swiss subdrainages are indicated by thick black lines. Relevant subdrainages of the Rhine in Switzerland are labelled (grey). The area referred to as “Lake Geneva region” in the text is also indicated. Names of populations showing evidence for recent bottlenecks (as indicated by the program BOTTLENECK using the infinite alleles mutation model) are underlined.

