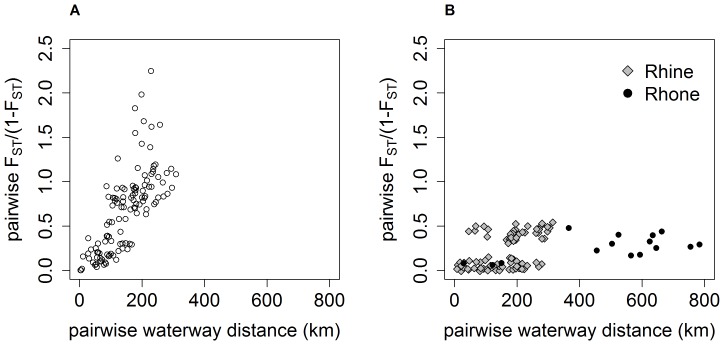
Figure 3. Isolation by distance plots for G. fossarum type A (left) and type B (right).
Only data for the Rhine drainage are shown for type A. For type B, data for the Rhine (grey diamonds) and Rhone (black circles) are shown. The relationship was significant in Mantel tests for type A (P = 0.0001) as well as type B in the Rhone (P = 0.0191), but not for type B in the Rhine (Table 1). Slopes are significantly different between species as indicated by non-overlapping 95% confidence intervals (Table 1). For type B in the Rhine drainage, the group with a higher degree of differentiation (FST/(1-FST)>0.3) contains pairs of populations from the two distinct clusters B1 and B2 (Fig. 2).

