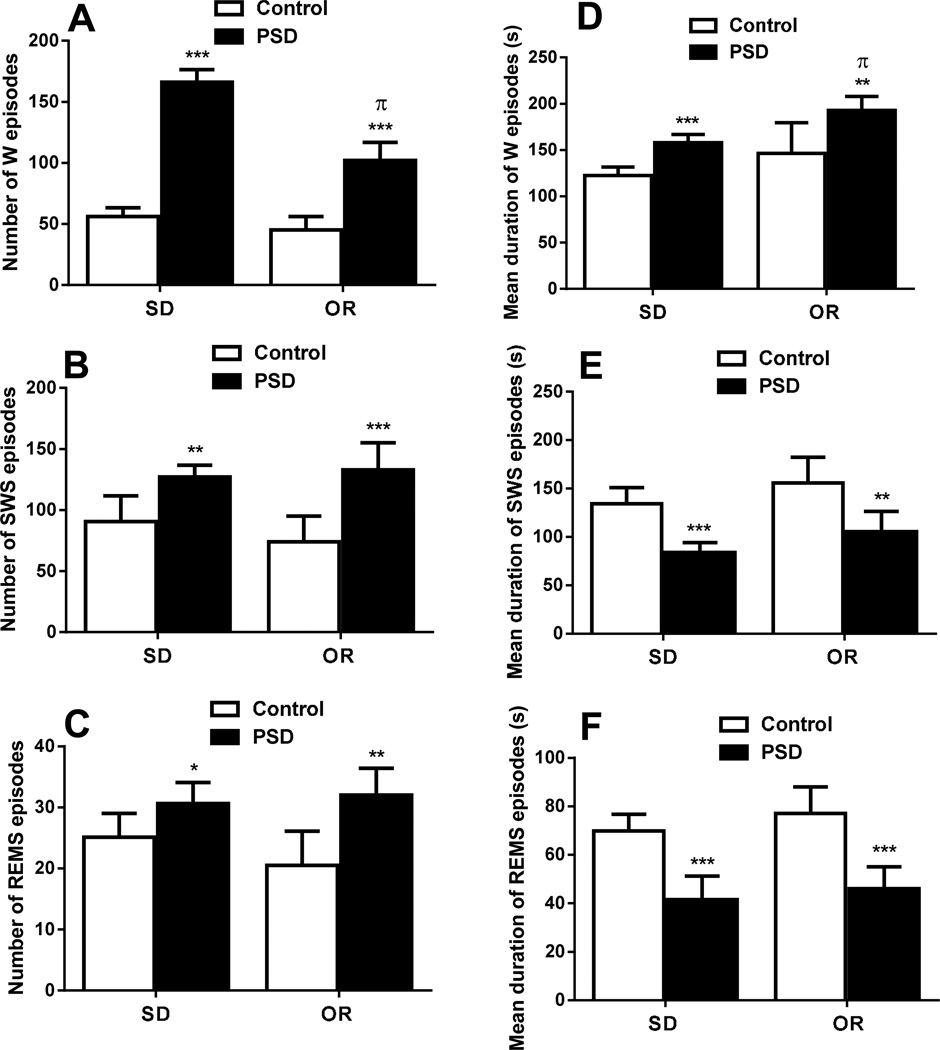
Figure 2.
Average number of wake (W), slow-wave-sleep (SWS) and REM sleep (REMS) episodes (A,B,C), and average duration (in sec) of W, SWS and REMS episodes (D,E.F) in obesity resistant (OR) and Sprague-Dawley (SD) rats. A, B and C represent the number of episodes during the 8 h recording period, of W, SWS and REMs respectively. D, E and F represent the average duration of episodes during the 8 h recording period, of W, SWS and REMs respectively. Results are expressed as means ± S.E.M. n = 6/group. *P < 0.05, **P < 0.01 and ***P < 0.001 as compared to controls. πP < 0.001 as compared to number of W episodes and duration of W episodes in SD rats during sleep deprivation (PSD).

