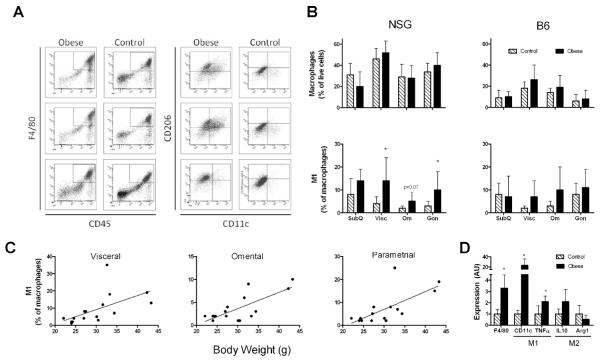
Figure 2. Obesity induces accumulation of activated macrophages in adipose tissue.
(A) Representative dot plots from visceral adipose tissue stromovascular fractions of three obese and control NSG mice. Live cells were gated based on DAPI and side scatter. Macrophages were defined as F4/80 and CD45 positive, and M1 and M2 determined based on expression of either CD11c or CD206. (B) Quantification of macrophages of various adipose depots from flow cytometry (n=4-8 per depot). (C) Correlation between percentage of M1 macrophages and body weight in NSG mice (n=16). See text for statistics. (D) Expression of selected macrophage M1 activation (left) and M2 alternatively activation (right) genes from parametrial adipose tissue of NSG mice (n=4 per diet group), measured by qPCR. (control = hatched bars, obese = solid bars). *p<0.05

