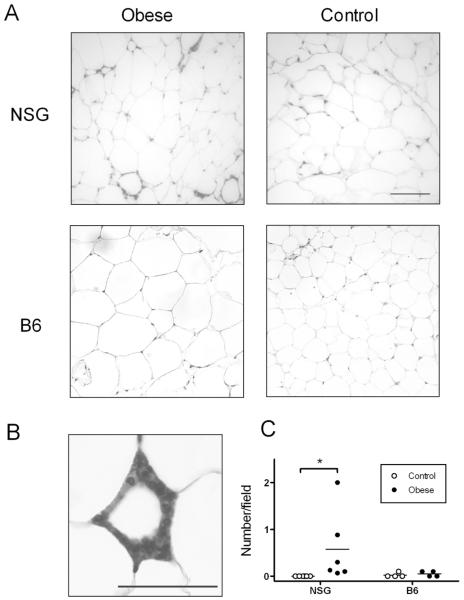
Figure 3. Immunohistochemical analysis of adipose tissue macrophages.
(A) Representative 20x fields of parametrial adipose tissue from obese (left) and control (right) NSG (top) and B6 (bottom) mice. Macrophages labeled with F4/80, calibration bar is 100 μm (see methods for staining procedures and microscope model). (B) Representative CLS from an obese NSG mouse labeled with F4/80. Photo taken at 63x magnification, calibration bar is 25 μm. (C) Quantification of macrophages found in crown like structures (CLS) in parametrial fat pads of NSG (n=6/group) and B6 (n=4/group) mice. CLSs were counted by a blinded observer in 15 fields at 20x magnification.

