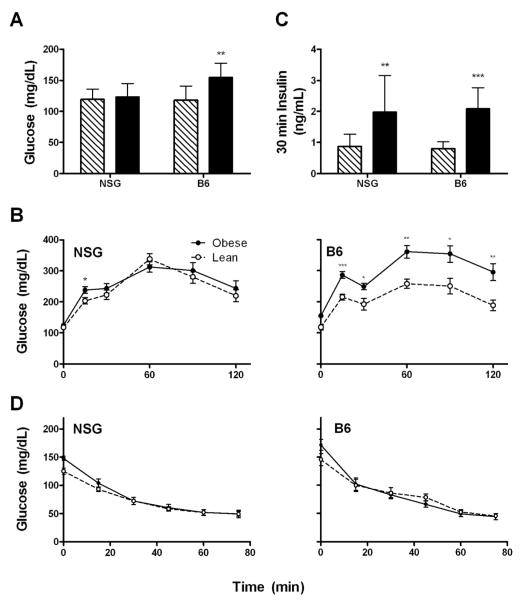
Figure 4. Physiological measures of obese and control mice.
(A) Fasting glucose (B) Serum insulin level 30 minutes post intraperitoneal glucose load, and (C) glucose levels during intraperitoneal glucose tolerance tests (NSG: n=14 obese, 17 control; B6: n=9 obese, 8 control). (D) Glucose concentrations during insulin tolerance tests (NSG: n=13 obese, 15 control; B6: n=9 obese, 5 control).

