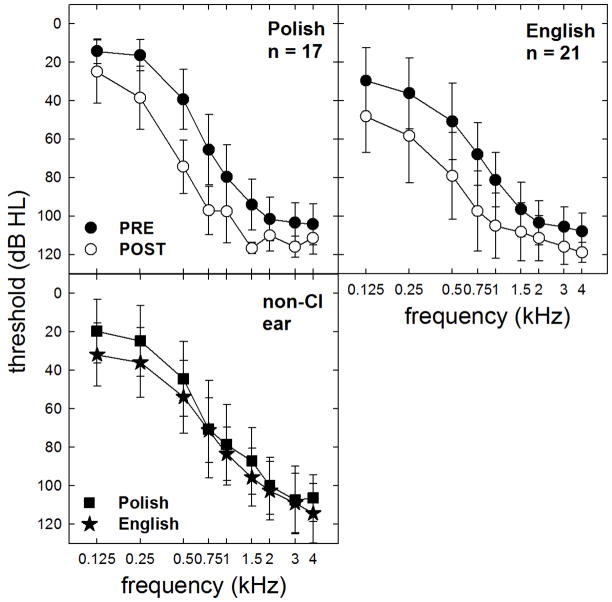
FIGURE 2.
Mean pre- and post-implant audiometric thresholds for the implanted ears of the Polish- and English-speaking participants are shown as filled and unfilled circles, respectively. Mean thresholds for the non-implanted ears of the Polish (filled squares) and English (filled stars) participants are also displayed. Error bars represent +/− 1 standard deviation.

