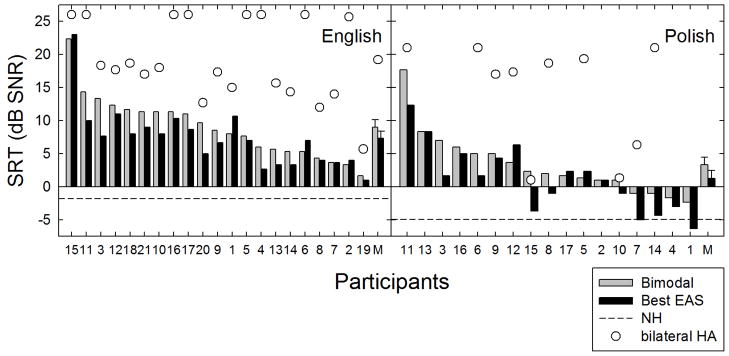
FIGURE 3.

Individual and mean speech reception thresholds (SRT) in dB SNR are shown for the bimodal (gray bars) and best aided EAS (black bars) listening conditions. Unfilled circles represent SRT data for the binaural aided condition. Error bars represent +/− 1 standard error.
