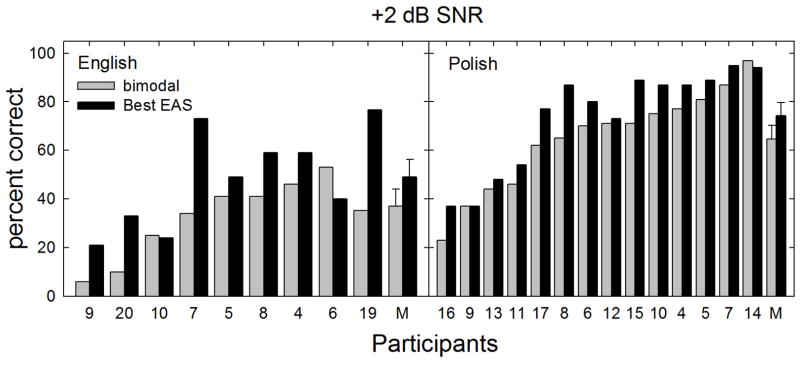
FIGURE 5.

Individual and mean speech recognition scores in percent correct are shown for fixed level SNR of +2 dB. The bimodal and best aided EAS listening conditions are represented by gray and black bars, respectively. Error bars represent +/− 1 standard error.
