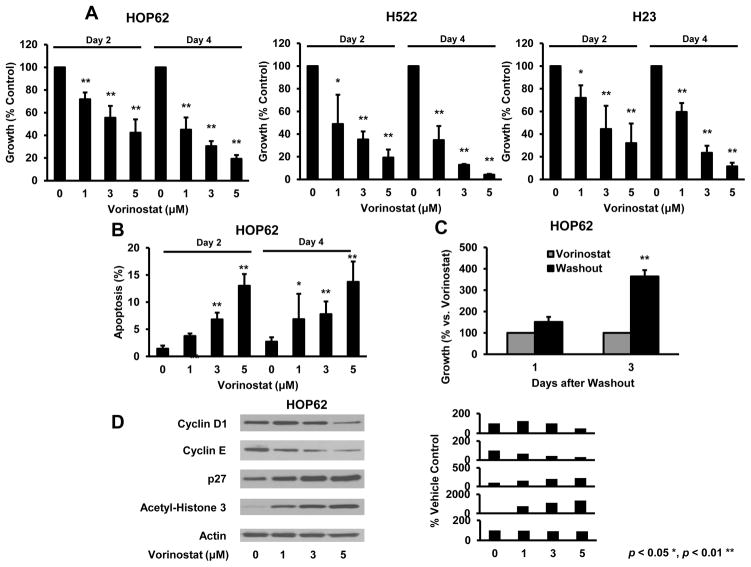
Fig. 3.
Vorinostat treatment effects in human lung cancer cell lines. (A) Vorinostat inhibited growth in a concentration- and time-dependent manner in HOP62 (left panel), H522 (middle panel) and H23 (right panel) human lung cancer cells versus vehicle controls. (B) Vorinostat induced apoptosis in a representative lung cancer cell line (HOP62). (C) Growth inhibition was antagonized by vorinostat washout of HOP62 cells. (D) Vorinostat induced similar dose-dependent changes in protein expression in human HOP62 versus murine lung cancer cell lines (Figs. 1 and 2). Signal intensity is shown in the right panel. Symbols * and ** revealed significant changes, P < 0.05 and P < 0.01, respectively.

