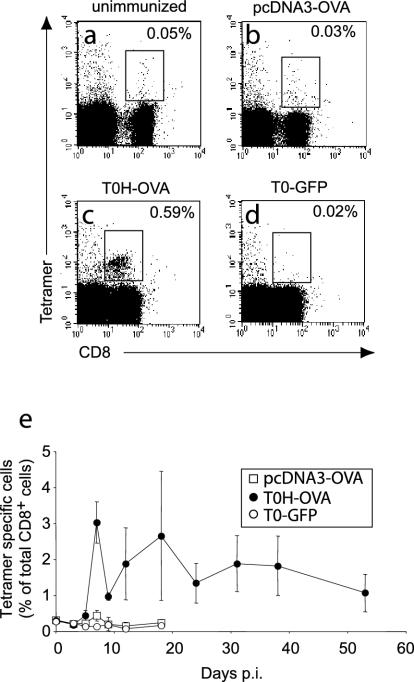
FIG. 1.
Visualization of antigen-specific CTL expansion after vaccination. PBL were stained with anti-CD8-APC and H-2Kb/OVA257-264 tetramers-phycoerythrin and analyzed by flow cytometry before (a) and 7 days after vaccination with pcDNA3-OVA (b), T0H-OVA (c), or T0-GFP (4 × 10⁶ virus particles i.v.) (d). The percentage of CD8+ Tet+ CTL among PBL is indicated on each plot. (e) The frequency of antigen-specific cells among peripheral blood CD8+ T cells was determined by H-2Kb/OVA257-264 tetramer staining for pcDNA3-OVA-, T0H-OVA-, and T0-GFP-immunized mice as shown (a to d). Data represent average values ± standard deviations (error bars) obtained from five mice per group at each time point. p.i., postimmunization.

