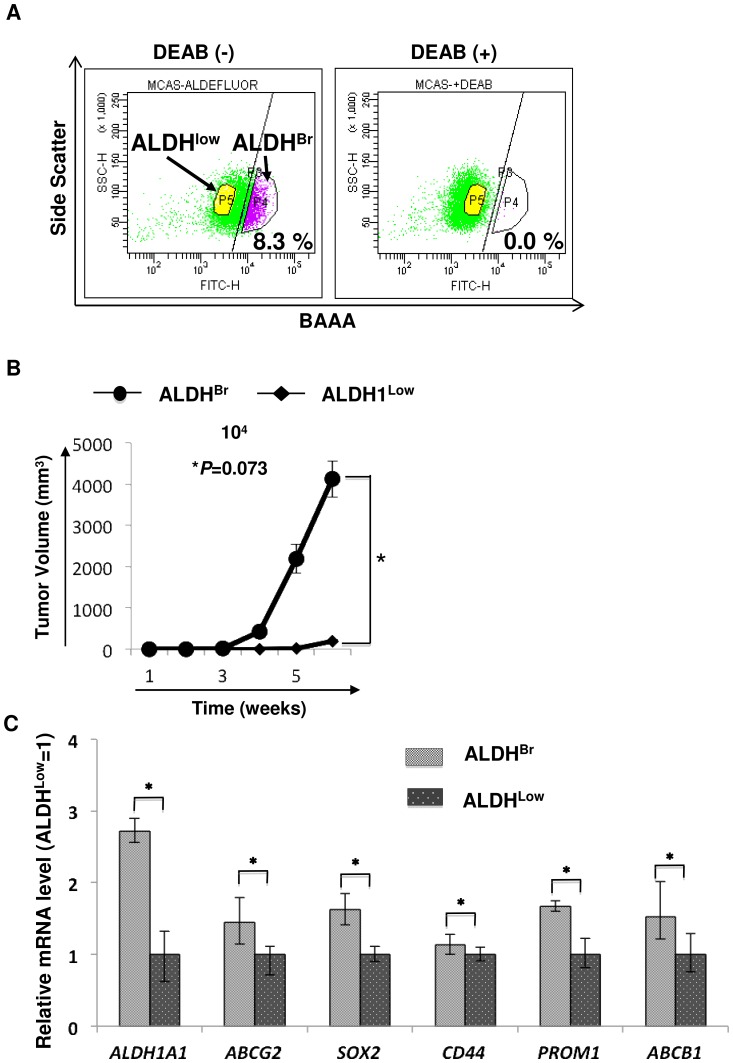
Figure 2. MCAS CSCs/CICs are enriched in ALDHBr cells.
A. Detection of ALDHBr cells from MCAS cells. MCAS ovarian mucinous adenocarcinoma cells were stained with BAAA and analyzed. The percentage represents the ratio of ALDHBr cells. Inhibitor indicate ALDH1 inhibitor (diethylamino- benzaldehyde (DEAB)). B. Tumor initiation of ALDHBr cells derived from MCAS cells. 104 ALDHBr and ALDHLow cells derived from MCAS cells were inoculated subcutaneously into the backs of NOD/SCID mice, and tumor growth was measured weekly. Data represent means ± SD. Differences between ALDHBr and ALDHLow cells were examined for statistical significance using Student's t-test. *P values. C. qPCR of CSC/CIC markers in MCAS SP and MP cells. Data represent means ± SD. Asterisks indicate significant difference. *P<0.05. t-test.

