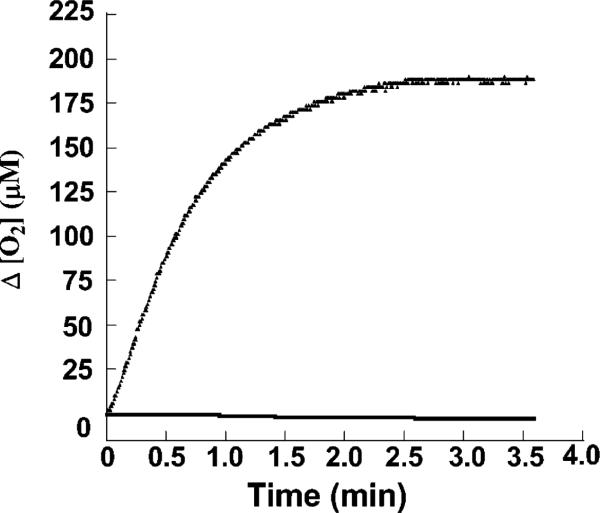
Figure 5.
Typical plots showing chlorite-dependent irreversible inactivation. Cld was incubated with chlorite sufficient to inactivate the sample ([heme] = 1.6 nM, [ClO2–] = 2200 μM), and the progress of reaction curve was monitored via oxygen evolution (exponential curve). After buffer exchange, no activity was observed (flat line).

