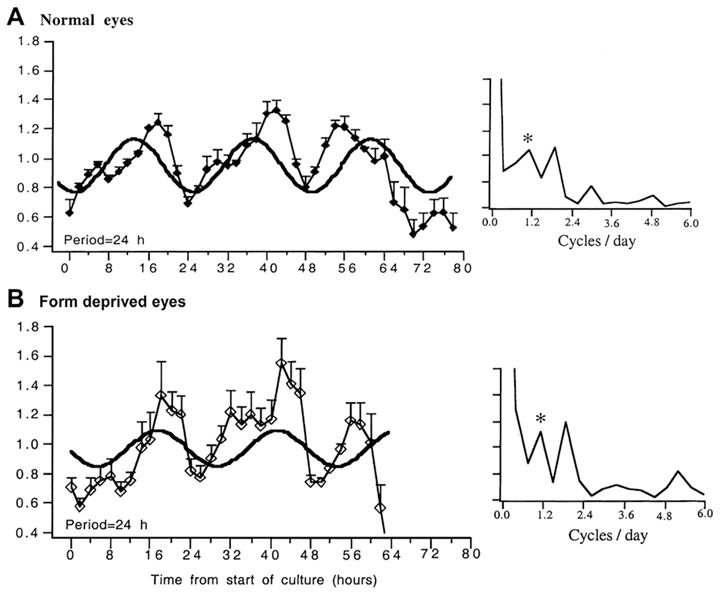
Fig. 3.

Rhythms in scleral glycosaminoglycan synthesis in the medium from isolated pieces of sclera measured at 2 h intervals over about 72 h; scleras from normal eyes (top) and form deprived eyes (bottom). The data are expressed as counts of sulfur-35 normalized to the mean for each experiment; bars are standard errors. Time 0 is the start of culture (x axis). The curves are the sine waves fit to the data, with the period indicated on bottom left of the graphs. On the right are spectral frequency (Fourier) analyses of the mean data, with the diurnal (1 per 24 h) frequency indicated by the asterisk. Note that both have a frequency component at 1.875 cycles per 24 h. Used with permission from Nickla et al. (1999)© Springer.
