
Fig. 4.
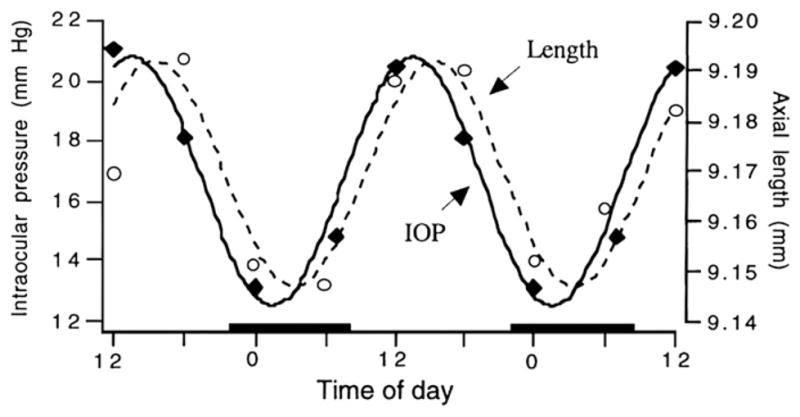
The rhythms in IOP (black symbols) and axial length (open symbols) and the sine waves with a fixed 24 h period, fit to the data. The data for the two parameters are from different sets of birds (n = 10 in each group). Black bars on x axis denote night. Used with permission from Nickla et al. (1998a)© Academic Press Limited.