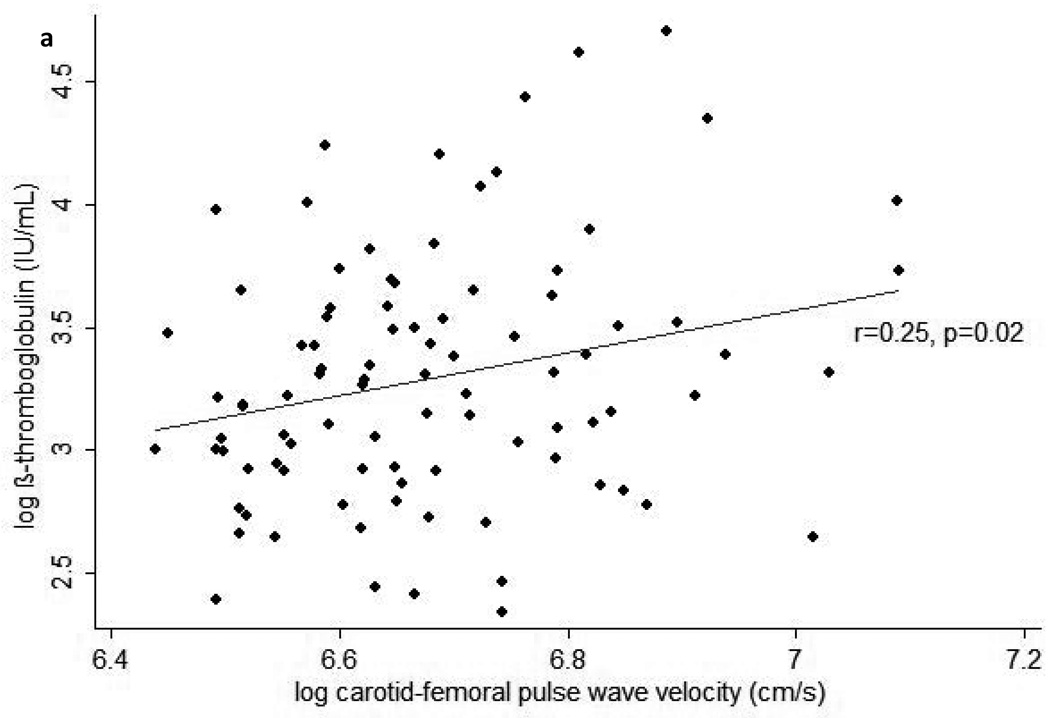
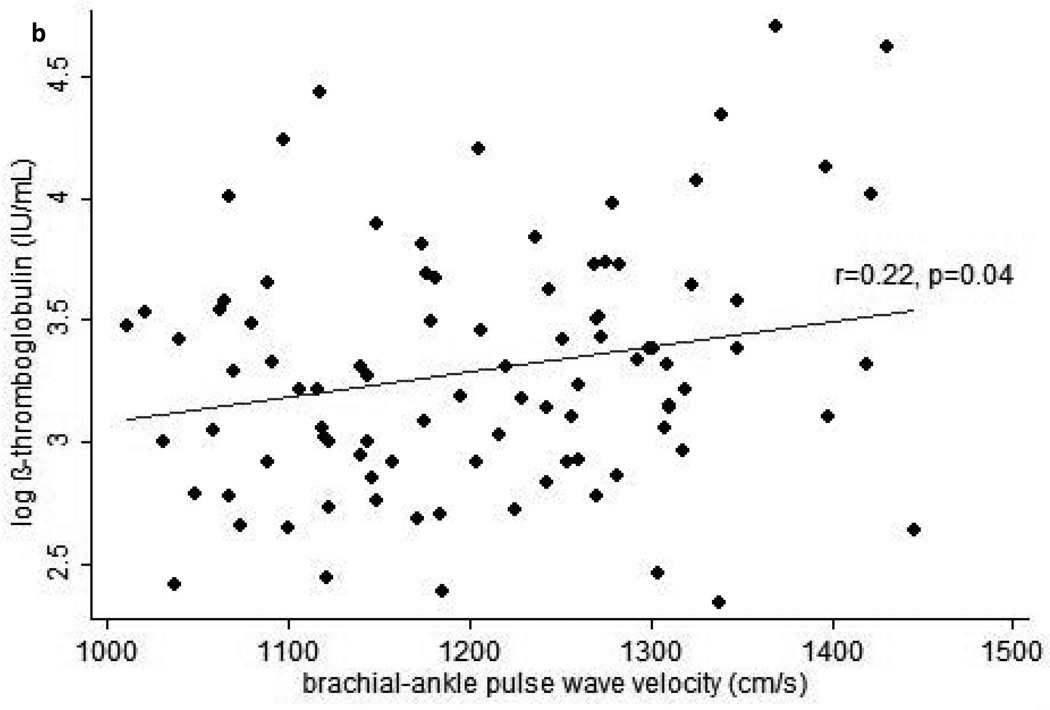
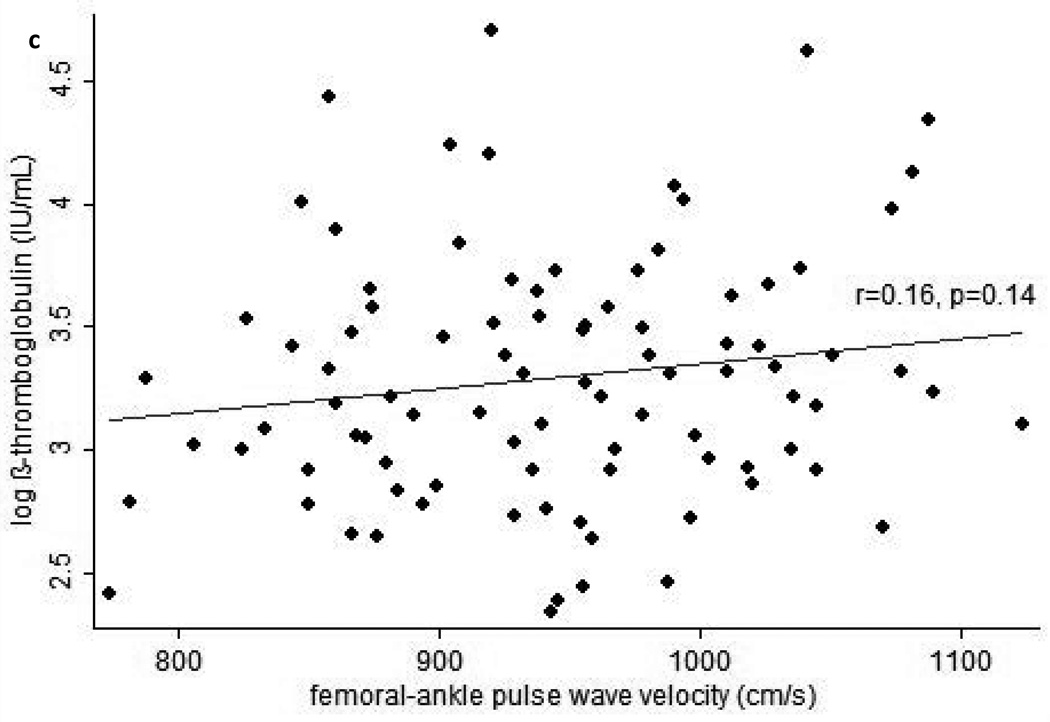
Figure 1.
Scatterplots of average pulse wave velocity (PWV) over 24-months vs. beta-thromboglobulin at the end of 24-months follow-up for (a) carotid-femoral PWV, (b) brachial-ankle PWV, and (c) femoral-ankle PWV. Average PWV values were calculated by integrating each subject’s estimated growth curve (derived from linear mixed models for the serial PWV measurements) over his or her total follow-up period, then dividing this value by the subject’s total follow-up time.


