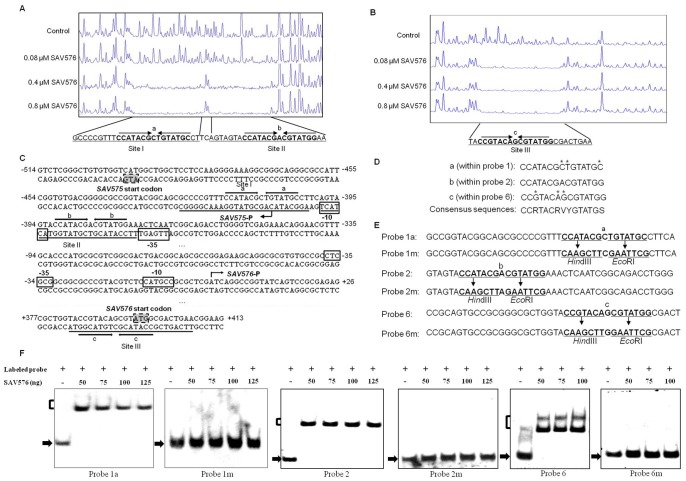
Figure 5. Determination of the binding sites of the SAV576 protein.
(A and B) DNase I footprinting assay of SAV576 on the SAV575 (A) and SAV576 (B) promoter regions, respectively. The fluorograms correspond to the control DNA (10 µM BSA) and to the protection reactions with increasing concentrations of His6-SAV576 protein, respectively. (C) Nucleotide sequence of the SAV575-SAV576 promoter region and SAV576-binding sites. The numbers indicate the distance (nt) from the transcriptional start point of SAV576. Solid lines, SAV576-binding sites; arrows, inverted repeats; bent arrows, transcriptional start points and transcription orientation; boxed areas, putative −10 and −35 regions; shaded areas, translational start codon. (D) Three 15-bp palindromic sequences “a”, “b”, and “c”. The mismatched nucleotides in comparison with sequence b are indicated by asterisks. (E) Mutations introduced into the 15-bp palindromic sequences. Each of the probes used was 43-bp. Probes 1a, 2, and 6 contained sequences a, b, and c, respectively. HindIII and EcoRI sites were generated at sequences a, b, and c to produce mutated probes 1m, 2m, and 6m, respectively. The nucleotides changed are indicated by underlining. (F) EMSAs using the mutated DNA probes. The free probes are indicated by solid arrows, and the retarded DNA fragments are indicated by parentheses.

