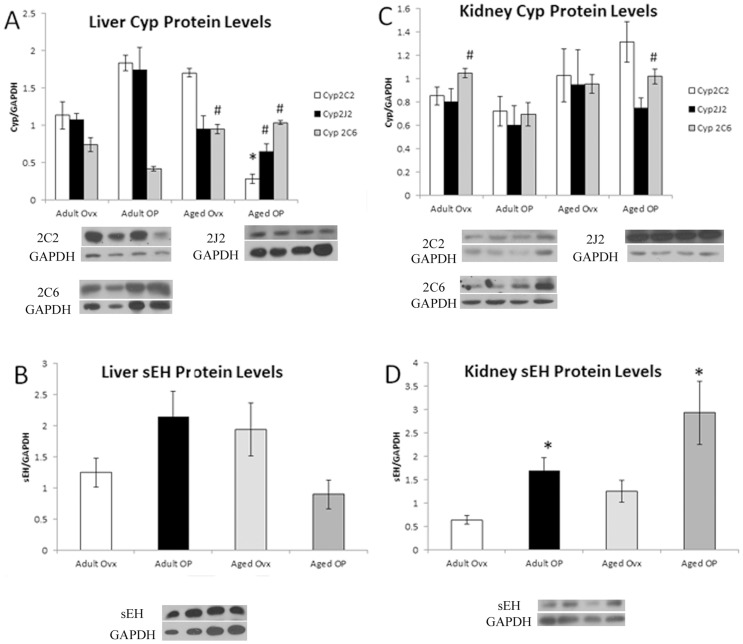
Figure 3. Western blot analysis of liver and kidney EETs related genes, normalized to GAPDH.
A representative Western blot showing bands from each of the 4 groups in the order they are given on the graph plus a representative GAPDH blot are shown for each graph. A: Cyp2C2, Cyp2J2 and Cyp2C6 in liver. B: sEH in liver. C: Cyp2C2, Cyp2J2 and Cyp2C6 in kidney. D: sEH in kidney. # P<0.05 compared with Adult OP, * P<0.05 compared with Adult Ovx; n = 9–11/group.

