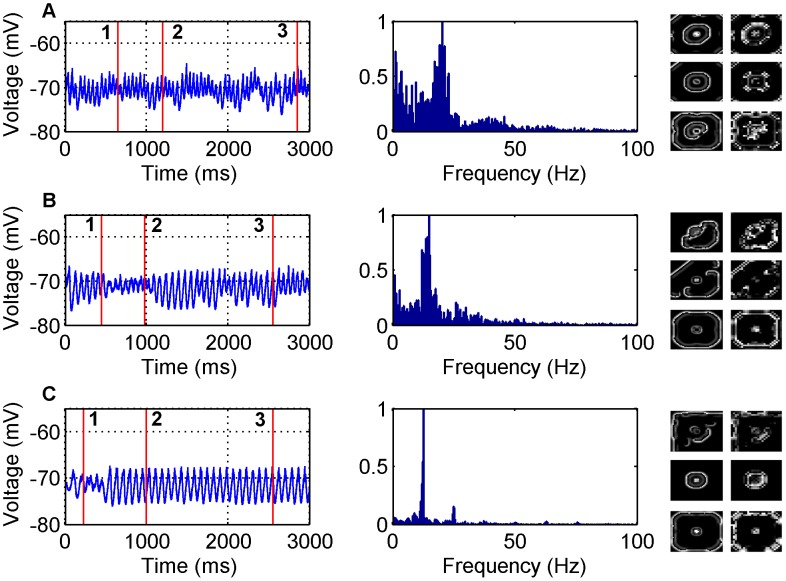
Figure 3. LFP simulations over a 3 second interval for the GABA antagonist model for various non-zero inhibitory synaptic weights and  .
.
In each row the simulated LFP in the time (left) and frequency (middle) domains are presented, along with snapshots of network activity (right) at different time steps during the simulation (A) - (1) 650 ms, (2) 1200 ms (3) 2800 ms, (B) - (1) 450 ms, (2) 980 ms, (3) 2550 ms, (C) - (1) 230 ms, (2) 1000 ms, (3) 2550 ms. The snapshots include both the excitatory (left) and inhibitory (right) populations. The parameter values used are: (A)  , (B)
, (B)  , (C)
, (C) .
.  .
.

