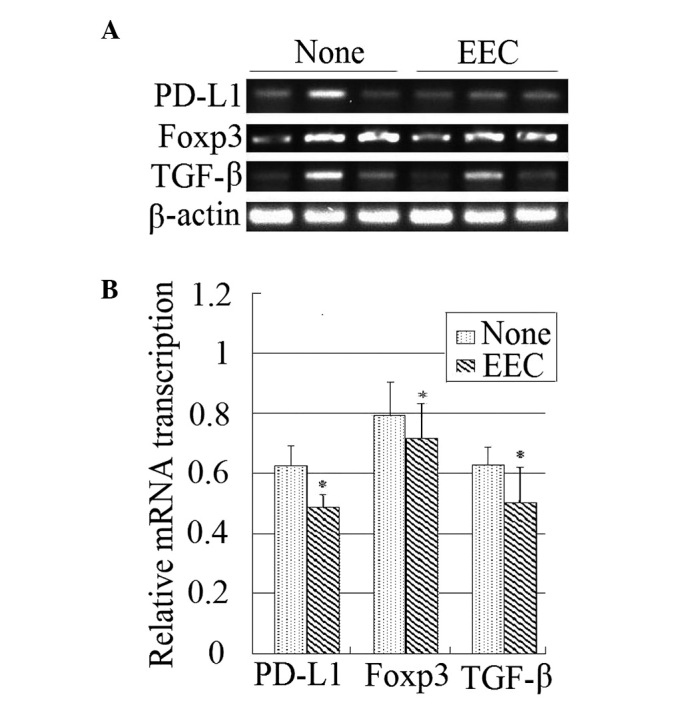
Figure 2.

(A) Agarose gel electrophoresis of reverse transcription polymerase chain reaction products. (B) Gel bands in the digitized image were selected and their average gray-scale density measured. The results were compared between groups. *P<0.05 vs. control. EEC, ethanol extract of Chaenomeles speciosa Nakai.
